Langfriststudie – Globales Immobilienportfolio und Aktien die beste Geldanlage
In meinem kommenden Podcast (8. August 2021) ist Moritz Schularick mein Gast. Er forscht und lehrt am Institut für Makroökonomik und Ökonometrie der Rheinischen Friedrich-Wilhelms-Universität Bonn. In seiner Forschung beschäftigt sich Schularick mit der monetären Makroökonomik, der internationalen Ökonomik und der Wirtschaftsgeschichte. Seine Studien zu den Ursachen von Finanzkrisen und zur Transformation des Finanzsystems gehören zu den international meistzitierten makroökonomischen Aufsätzen des letzten Jahrzehnts.
Grund genug für mich einige seiner Studien, die bei bto in der Vergangenheit bereits vorgestellt wurden, erneut zu diskutieren. Heute die 2018 erstmals besprochene Studie zu den langfristigen Renditen verschiedener Anlageformen:
Es gibt schon seit Jahren Langfriststudien von Banken zu den Erträgen und Risiken verschiedener Anlageklassen. Nun kommt eine akademische Studie hinzu, die nicht nur mit der Länge (mehr als 100 Jahre) und der Breite (inklusive Immobilien) der Analyse beeindruckt.
“The rate of Return on Everything 1870-2015” von Òscar Jordà, Katharina Knoll, Dmitry Kuvshinov, Moritz Schularick, and Alan M. Taylor, erschienen als NBER Working Paper 24112. Der Link wie immer am Ende.
Es war eine sehr interessante Lektüre. Hier die Highlights:
Zunächst die Zusammenfassung:
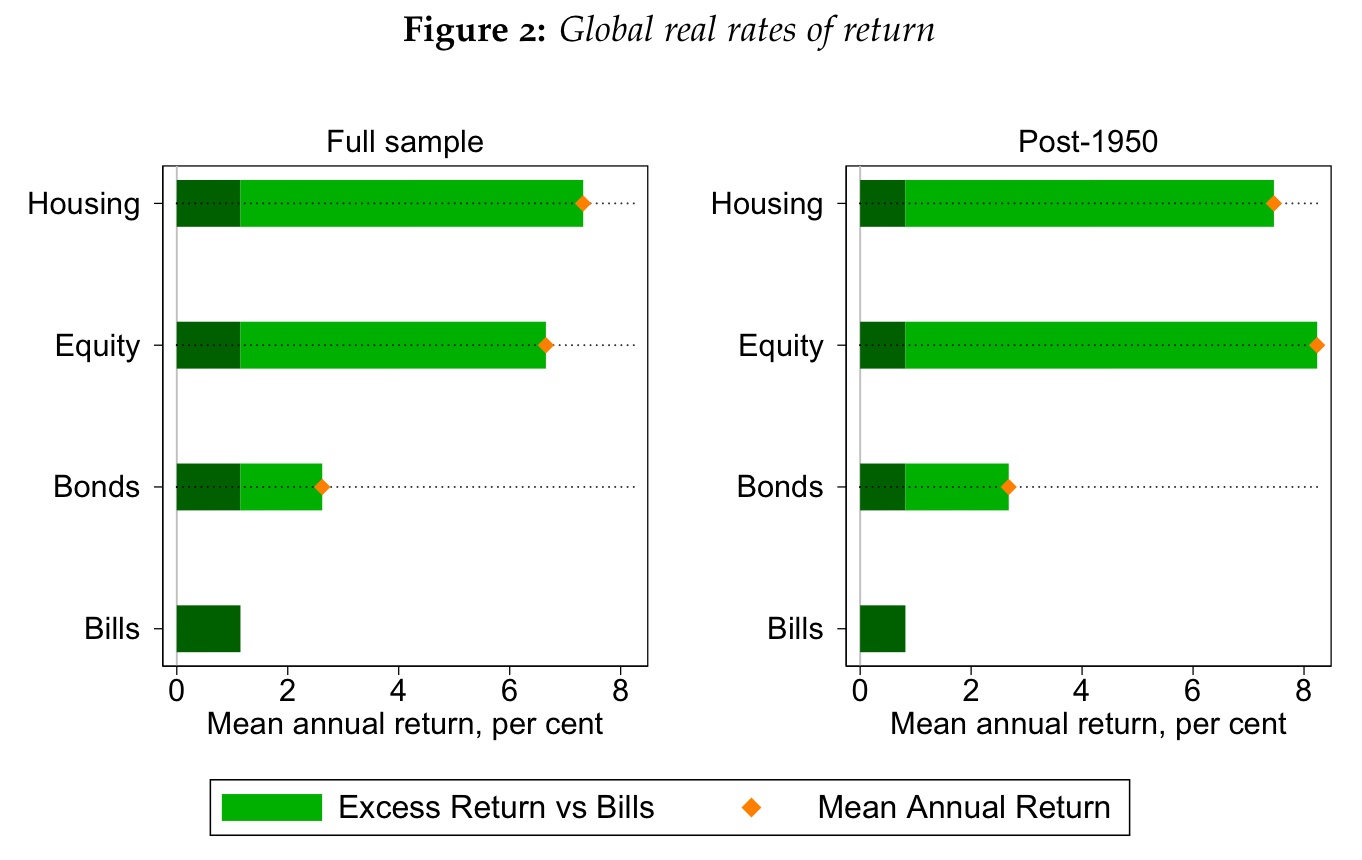
- “In terms of total returns, residential real estate and equities have shown very similar and high real total gains, on average about 7% per year. (…) The observation that housing returns are similar to equity returns, yet considerably less volatile, is puzzling. Diversification with real estate is admittedly harder than with equities.” – bto: Bisher wurde immer angenommen, dass Immobilien weniger abwerfen. (Vielleicht auch, weil es Studien von Banken waren?)
Quelle: NBER Working Paper 24112
- “Before WW2, the real returns on housing and equities (and safe assets) followed remarkably similar trajectories. After WW2 this was no longer the case, and across countries equities then experienced more frequent and correlated booms and busts. The low covariance of equity and housing returns reveals significant aggregate diversification gains (i.e., for a representative agent) from holding the two asset classes.” – bto: was wiederum sehr interessant ist.
- “It is not just that housing returns seem to be higher on a rough, risk-adjusted basis. It is that, while equity returns have become increasingly correlated across countries over time (specially since WW2), housing returns have remained uncorrelated. Again, international diversification may be even harder to achieve than at the national level. But the thought experiment suggests that the ideal investor would like to hold an internationally diversified portfolio of real estate holdings, even more so than equities.” – bto: Das könnte ein interessantes Produkt für Kapitalanleger sein.
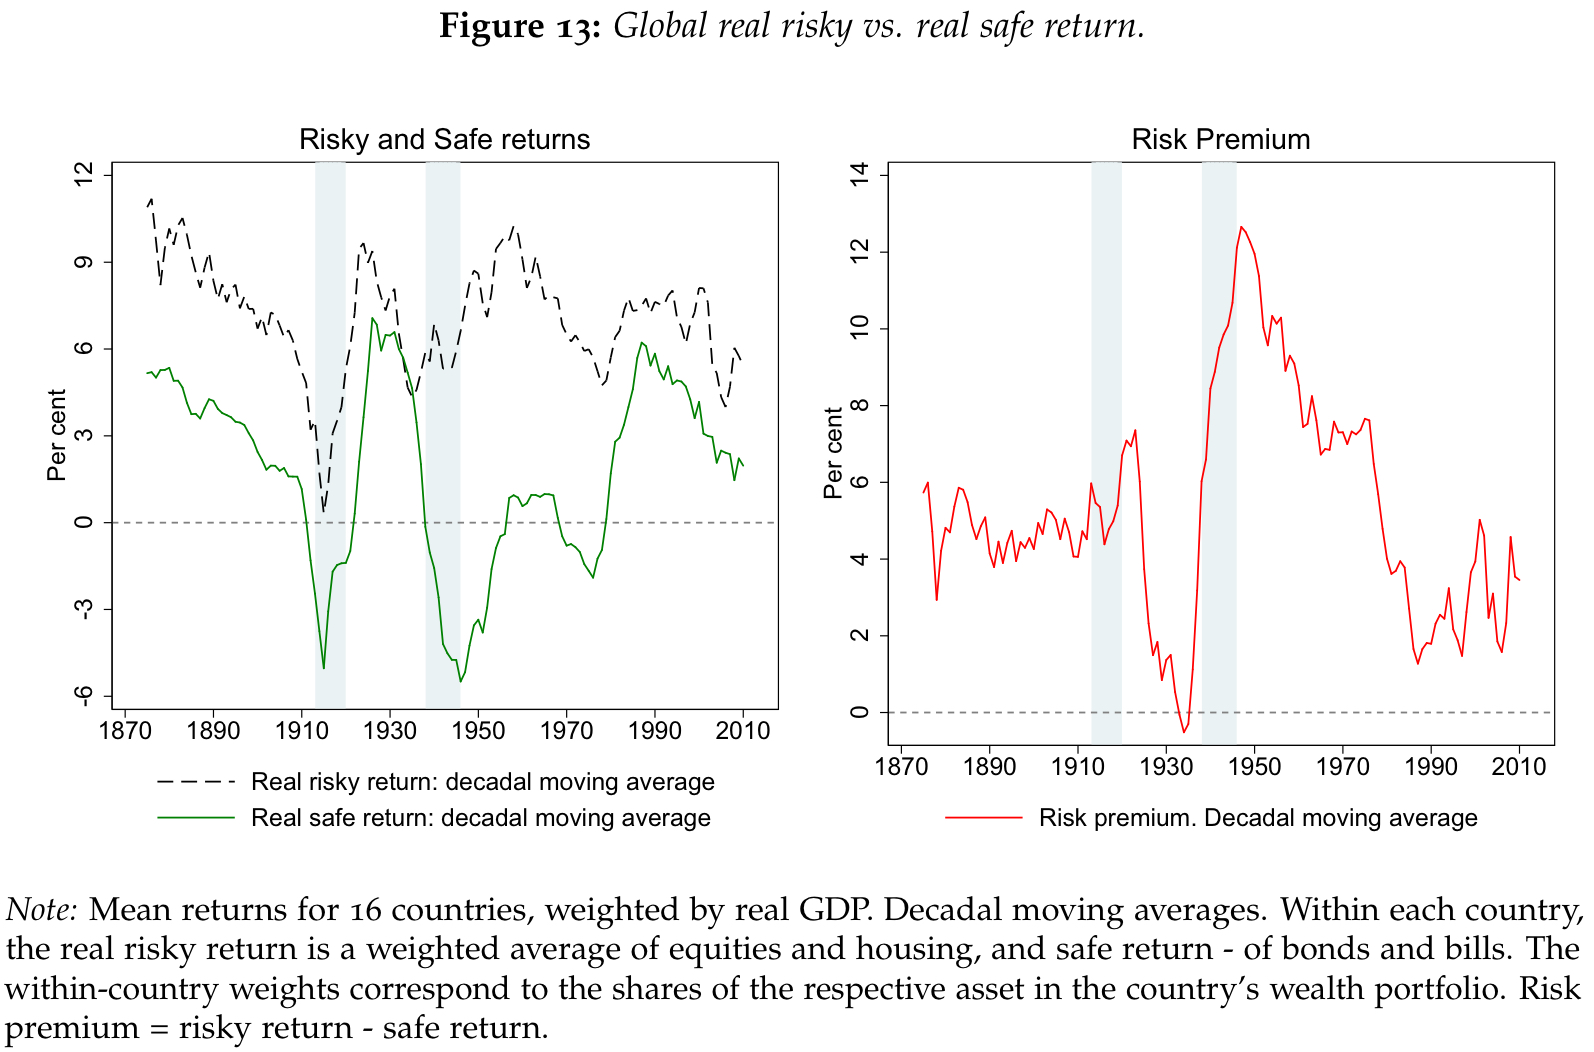
- “We find that the real safe asset return has been very volatile over the long-run, more so than one might expect, and oftentimes even more volatile than real risky returns. (…) Viewed from a long-run perspective, it may be fair to characterize the real safe rate as normally fluctuating around the levels that we see today, so that today’s level is not so unusual. Consequently, we think the puzzle may well be why was the safe rate so high in the mid-1980s rather than why has it declined ever since.” – bto: Das lässt die ganze Diskussion zur Rolle der Notenbanken in einem anderen Licht erscheinen. Wäre es doch der Markt, nicht die Notenbanken, die die tiefen Zinsen verursachen? Ich denke, die Argumentation hat etwas.
- “Over the very long run, the risk premium has been volatile. (…) In most peacetime eras this premium has been stable at about 4%–5%. (…) there is no visible long-run trend, and mean reversion appears strong. Curiously, the bursts of the risk premium in the wartime and interwar years were mostly a phenomenon of collapsing safe rates rather than dramatic spikes in risky rates. In fact, the risky rate has often been smoother and more stable than safe rates, averaging about 6%–8% across all eras.” – bto: Fand ich sehr interessant.
- “Recently, with safe rates low and falling, the risk premium has widened due to a parallel but smaller decline in risky rates. But these shifts keep the two rates of return close to their normal historical range. Whether due to shifts in risk aversion or other phenomena, the fact that safe rates seem to absorb almost all of these adjustments seems like a puzzle in need of further exploration and explanation.” – bto: Und es widerspricht der derzeitigen Diskussion zu Zinsniveau und Ursachen.
- Dann kommt noch als Zusatzanalyse die Frage nach der „Piketty-Regel“: “Turning to real returns on all investable wealth, Piketty (2014) argued that, if the return to capital exceeded the rate of economic growth, rentiers would accumulate wealth at a faster rate and thus worsen wealth inequality. Comparing returns to growth, or ‘r minus g’ in Piketty’s notation, we uncover a striking finding. Even calculated from more granular asset price returns data, the same fact reported in Piketty (2014) holds true for more countries and more years, and more dramatically: namely ‘r ≫ g.’” – bto: Das ziehe ich bekanntlich in Zweifel, weil es auch erhebliche Vermögensvernichtung gibt und der dahinterliegende Grund – der Leverage – vernachlässigt wird.
Und jetzt der tiefere Einstieg in die vielen interessanten Ergebnisse der Studie:
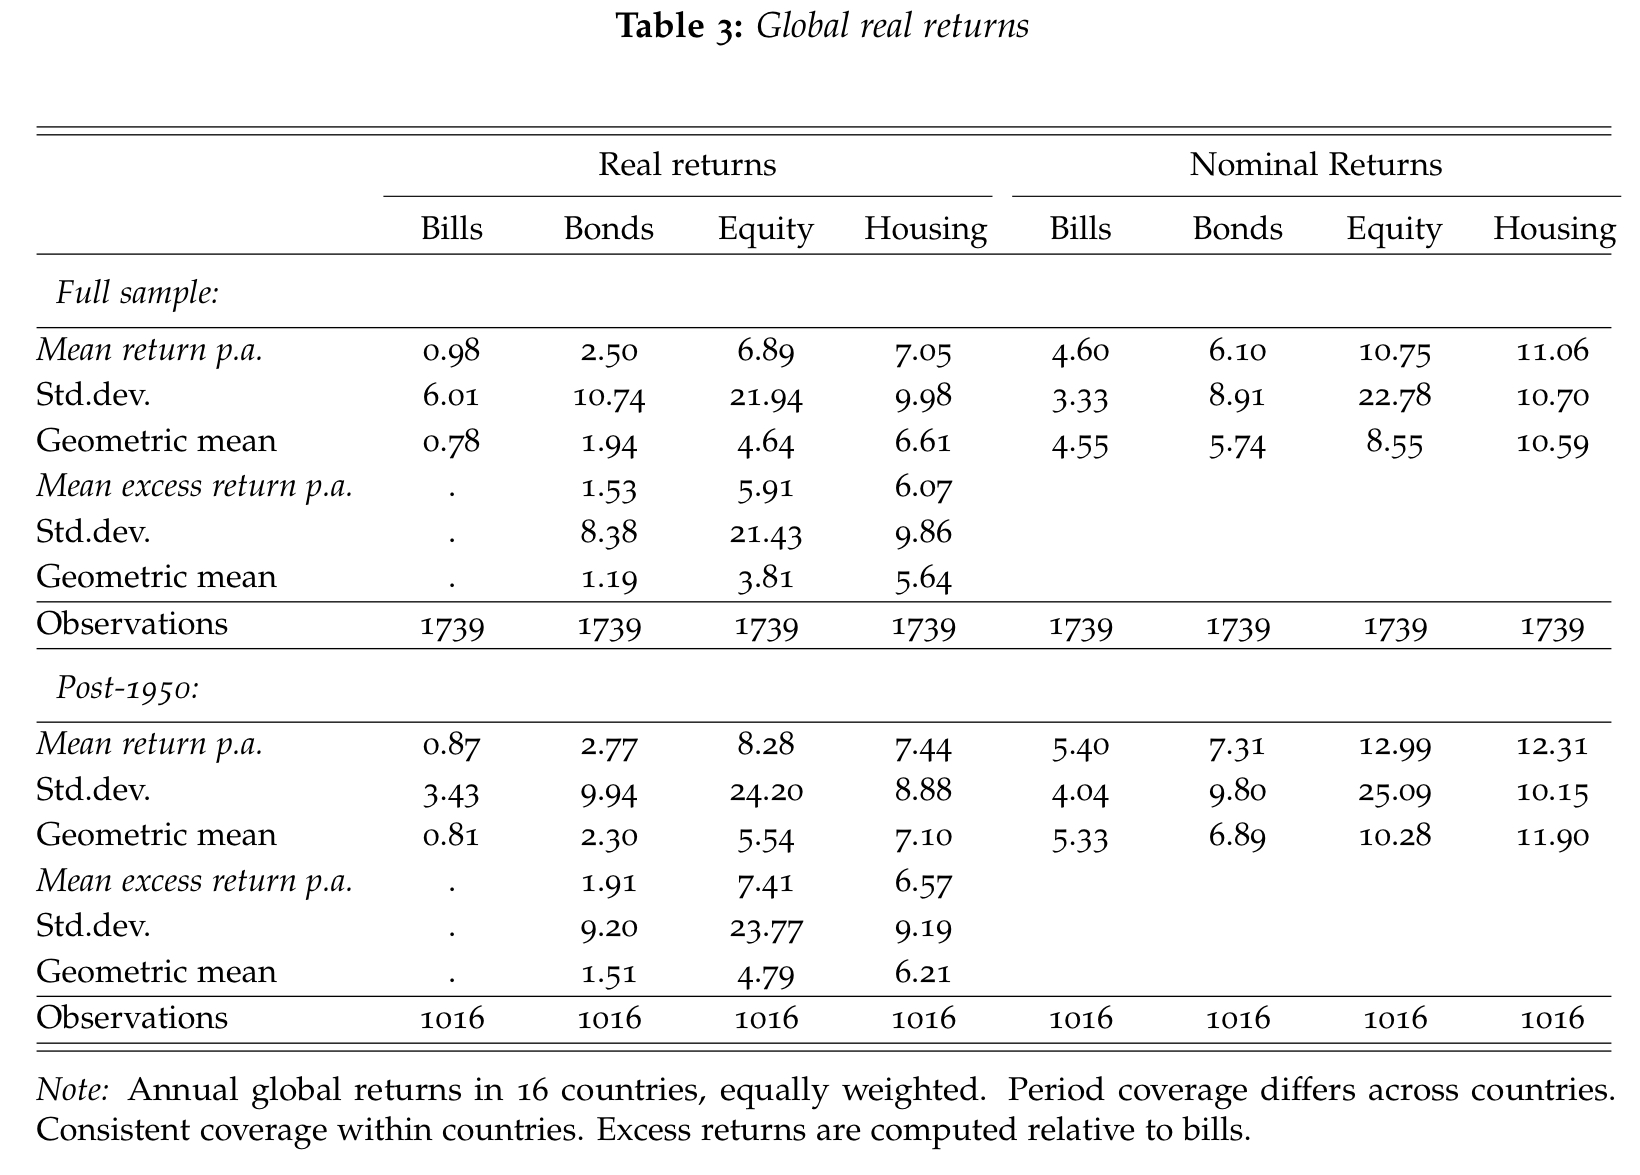
- “Although returns on housing and equities are similar, the volatility of housing returns is substantially lower, as Table 3 shows. Returns on the two asset classes are in the same ballpark — around 7% — but the standard deviation of housing returns is substantially smaller than that of equities (10% for housing versus 22% for equities). (…) This finding appears to contradict one of the basic assumptions of modern valuation models: higher risks should come with higher rewards.” – bto: wobei – wie gesagt – es nicht richtig ist, Risiko mit Volatilität gleichzusetzen. Ich denke, bei Immobilien gibt es weitaus mehr Risiken in Form von staatlichen Eingriffen und Besteuerungen.
 Quelle: NBER Working Paper 24112
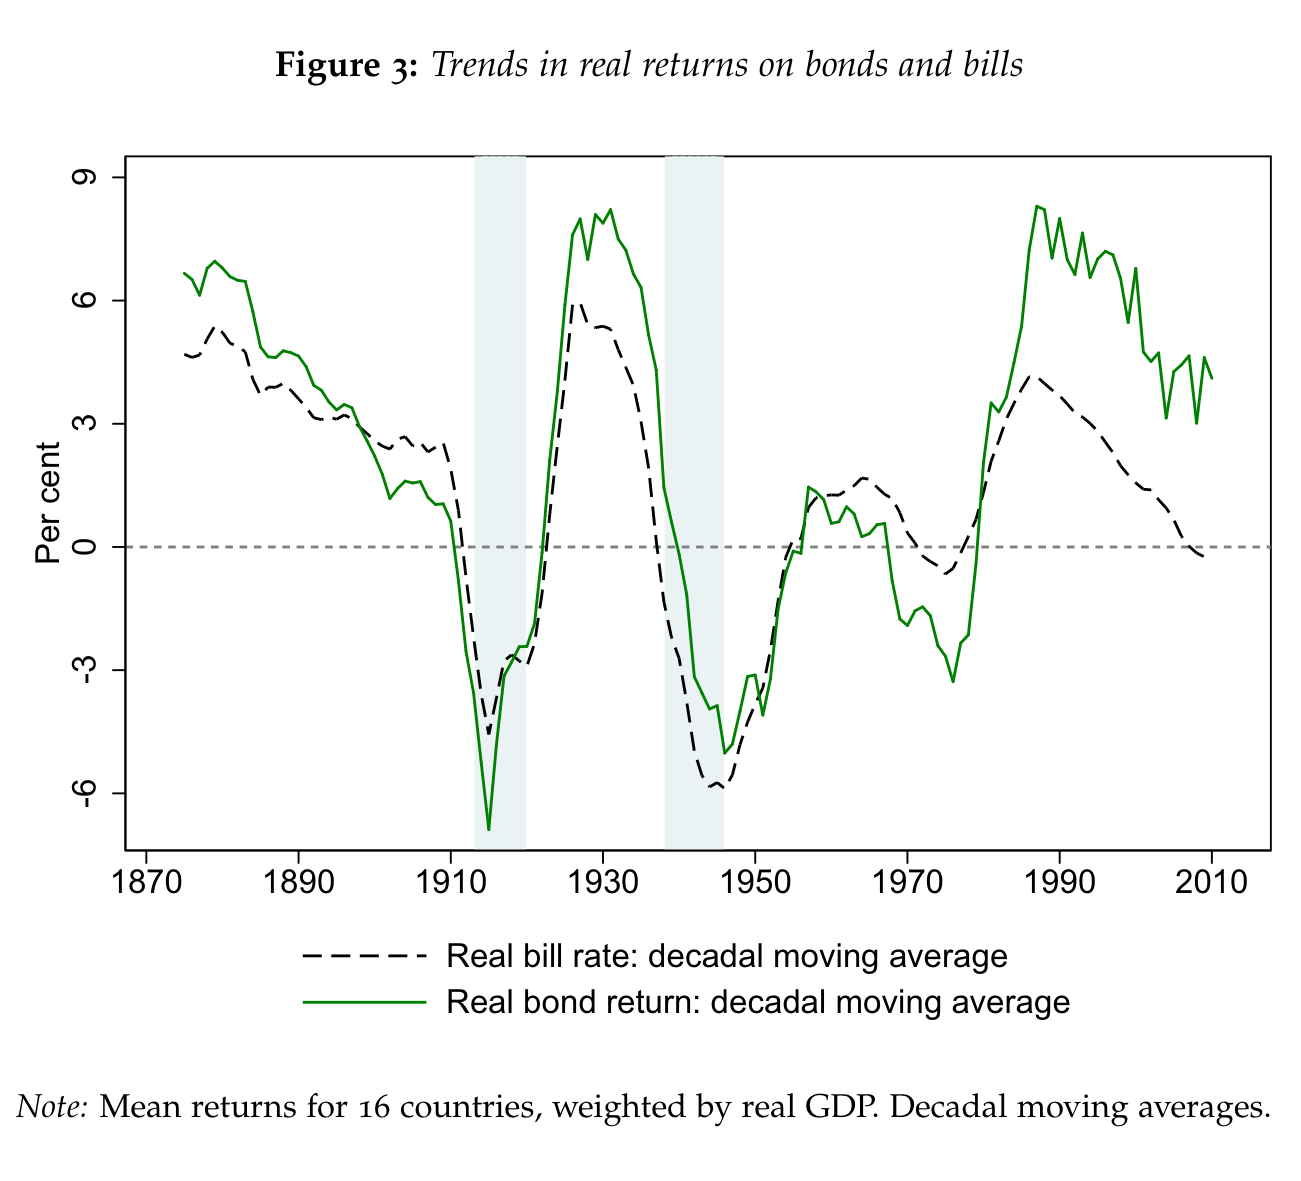
- “Safe rates are far from stable in the medium-term. There is enormous time series, as well as cross-country variability. In fact, real safe rates appear to be as volatile (or even more volatile) than real risky rates, (…) Considerable variation in the risk premium often comes from sharp changes in safe real rates, not from the real returns on risky assets.” – bto: Es ist also vor allem der risikofreie Zins, der Unterschiede erklärt.
 Quelle: NBER Working Paper 24112
- “Returns dip dramatically during both world wars. It is perhaps to be expected: demand for safe assets spikes during disasters although the dip may also reflect periods of financial repression that usually emerge during times of conflict, and which often persist into peacetime. Thus, from a broad historical perspective, high rates of return on safe assets and high term premiums are more the exception than the rule.” – bto: Das ist gerade mit Blick auf die Geldpolitik sehr interessant. Es wäre dann besser, es zu akzeptieren, statt es mit immer mehr schädlichen Mitteln zu bekämpfen.
- “(…) during the late 19th and 20th century, real returns on safe assets have been low—on average 1% for bills and 2.5% for bonds—relative to alternative investments. Although the return volatility—measured as annual standard deviation—is lower than that of housing and equities, these assets offered little protection during high-inflation eras and during the two world wars, both periods of low consumption growth.” – bto: Das sollte eigentlich nicht überraschen. Es sind nun mal keine “Real-Assets” und deshalb unterliegen sie Kontrahenten- und Entwertungsrisiken.
- “(…) safe rates of return have important implications for government finances, as they measure the cost of raising and servicing government debt. What matters for this is not the level of real return per se, but its comparison to real GDP growth, or rsa f e − g. If the rate of return exceeds real GDP growth, rsa f e > g, reducing the debt/GDP ratio requires continuous budget surpluses. (…) Starting in the late 19th century, safe rates were higher than GDP growth, meaning that any government wishing to reduce debt had to run persistent budget surpluses. (…) After World War 2, on the contrary, high growth and inflation helped greatly reduce the value of national debt, creating rsa f e − g gaps as large as –10 percentage points.” – bto: Das hat natürlich auch mit der Loslösung des Geldes vom Gold zu tun! Inflation ist kein Zufall, sondern politisch erwünscht.
- “On average throughout our sample, the real growth rate has been around 1 percentage point higher than the safe rate of return (3% growth versus 2% safe rate), meaning that governments could run small deficits without increasing the public debt burden.” – bto: wie gesagt, die heimliche Steuer auf alle Ersparnisse zugunsten der „Allgemeinheit“ (oder er zugunsten der „Reichen“, die besser investieren können?)
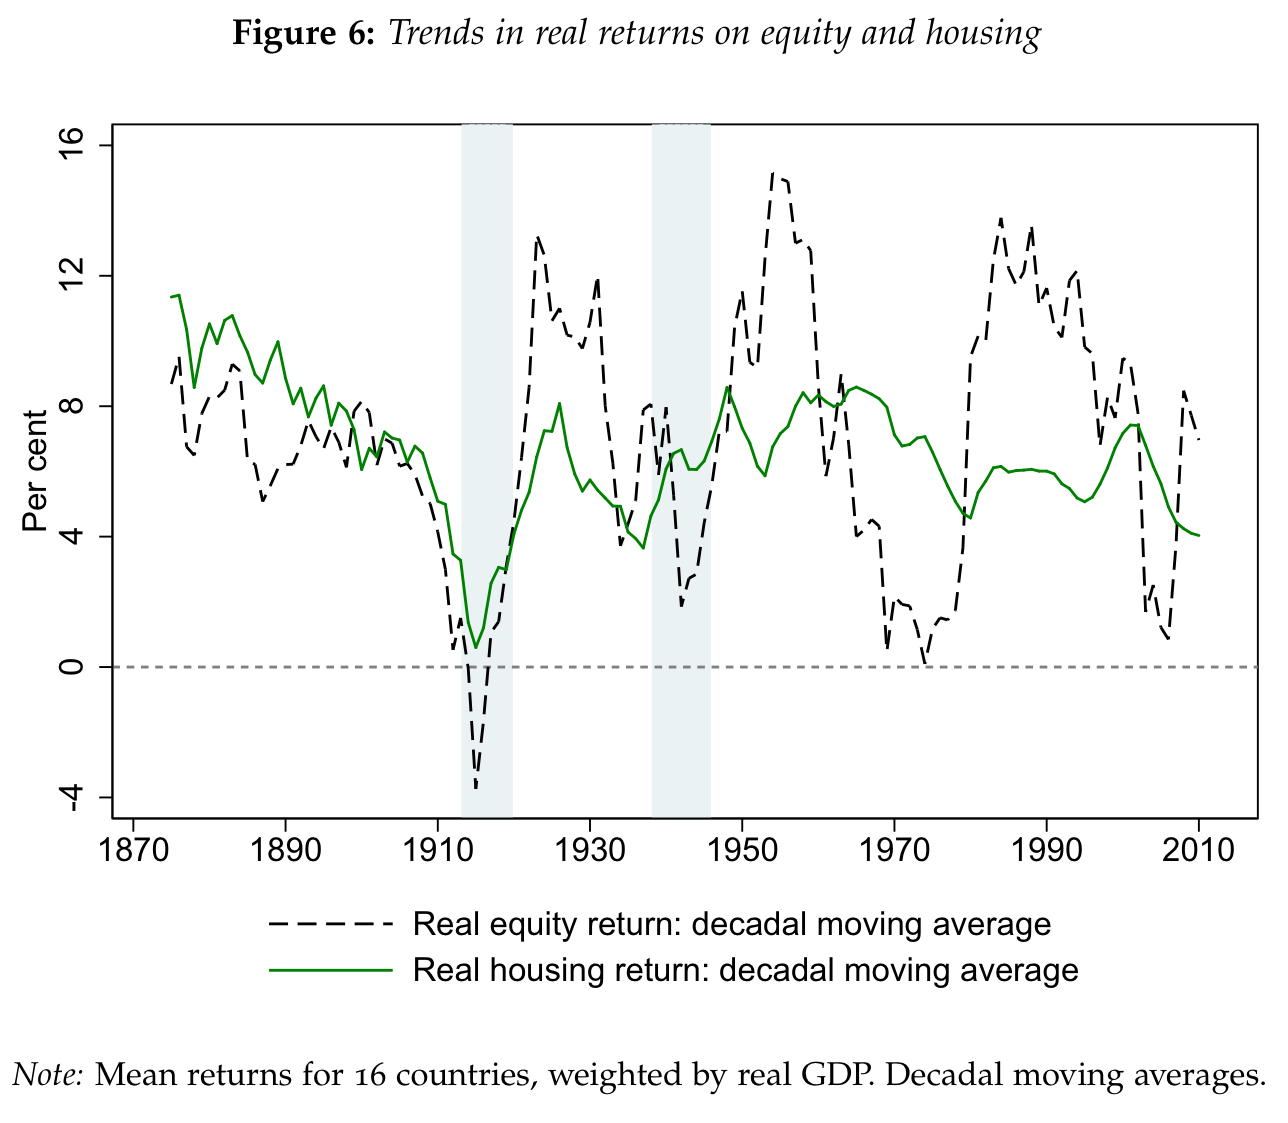
- “Equity returns have experienced many pronounced global boom-bust cycles, much more so than housing returns, with real returns as high as 16% and as low as −4% over the course of entire decades.” – bto: was eigentlich zu höheren langfristigen Erträgen führen sollte, aber eben nicht tut. Könnte es sein, dass der Ertrag einfach der Ertrag ist und das Volatilitäts-gemessene Risiko ein anderes?
 Quelle: NBER Working Paper 24112
- “In terms of relative returns, housing persistently outperformed equity up until the end of WW1, even though the returns followed a broadly similar temporal pattern. In recent decades, equities have slightly outperformed housing on average, but only at the cost of much higher volatility and cyclicality. Furthermore, the upswings in equity prices have generally not coincided with times of low growth or high inflation, when standard theory would say high returns would have been particularly valuable.” – bto: eine sehr interessante Nachricht. Der vermeintliche Inflationsschutz ist mit Aktien nicht gegeben. Darauf habe ich in meiner Serie „Was tun mit dem Geld?“ übrigens ebenfalls hingewiesen.
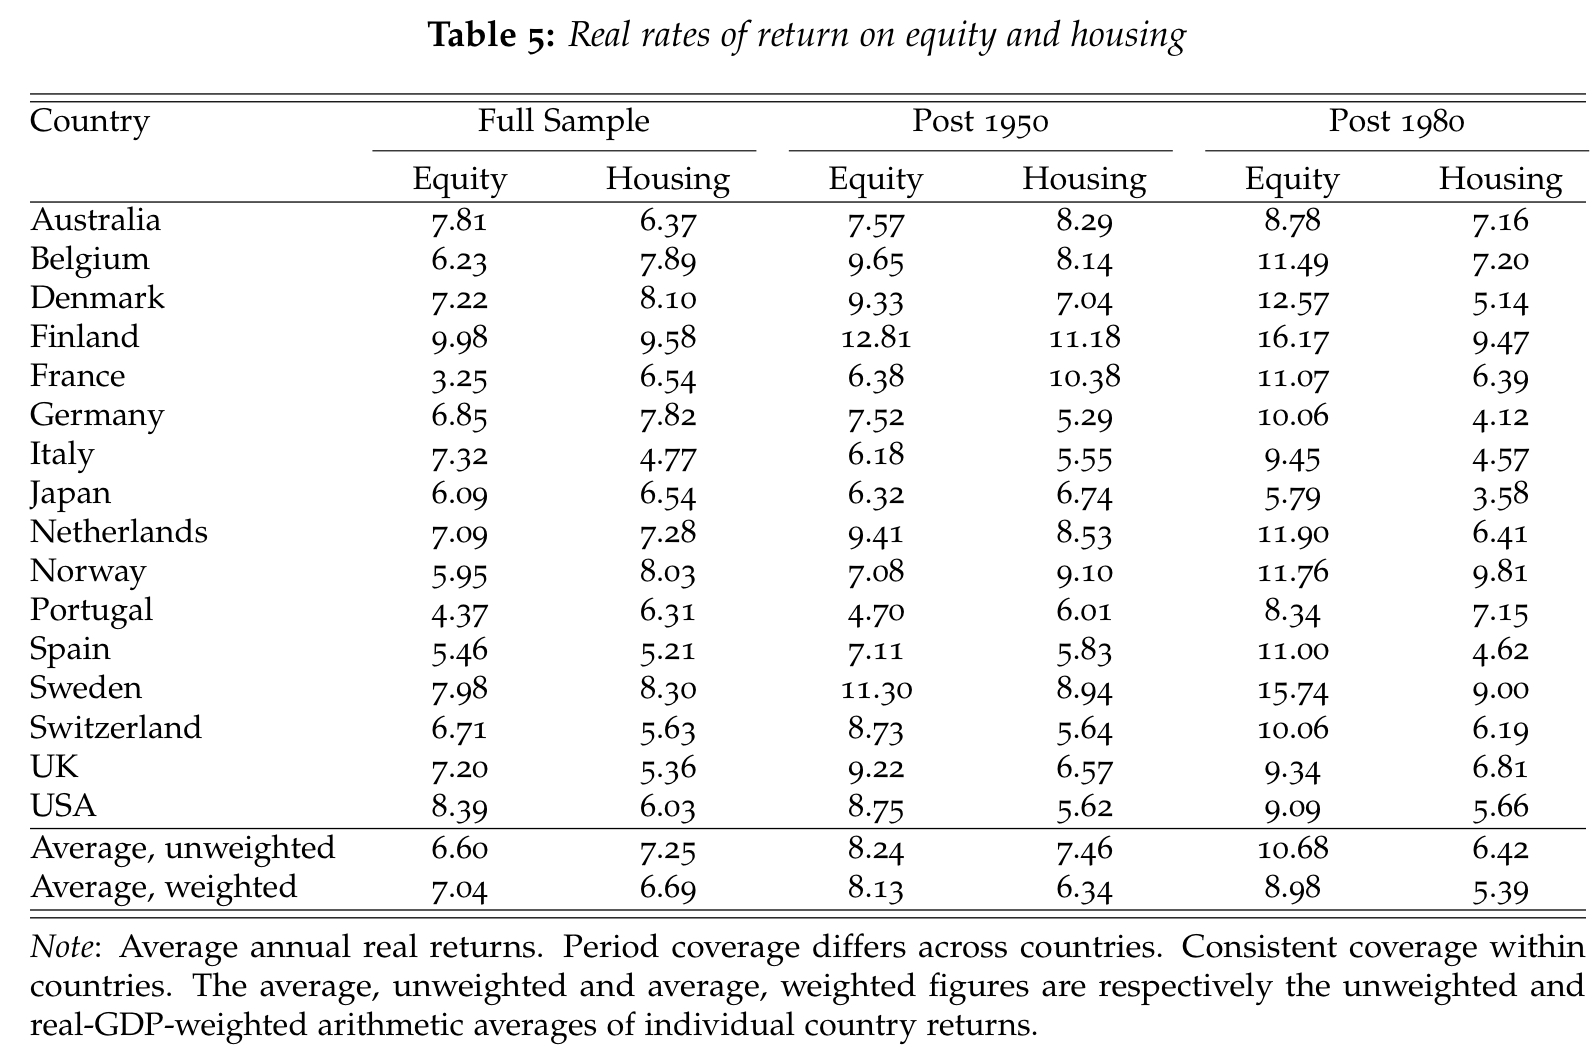
- “Table 5 shows the returns on equities and housing by country for the full sample and for the post–1950 and post–1980 subsamples. Long-run risky asset returns for most countries are close to 6%–8% per year, a figure which we think represents a robust and strong real return to risky capital.” – bto: in der Tat ein sehr erfreuliches Ergebnis. Doch auch hier kam es immer wieder zu Phasen erheblicher Vermögensvernichtung, auf die wir uns einstellen müssen. Gerade heute würde ich eine unzureichende Risikoprämie an den Märkten ausmachen. Dazu genügt ein Blick auf die Bewertungen im Bereich der High-Yield-Bonds. Wenn diese in Europa weniger abwerfen als zehnjährige US-Staatsanleihen, dann ist etwas nicht in Ordnung!
 Quelle: NBER Working Paper 24112
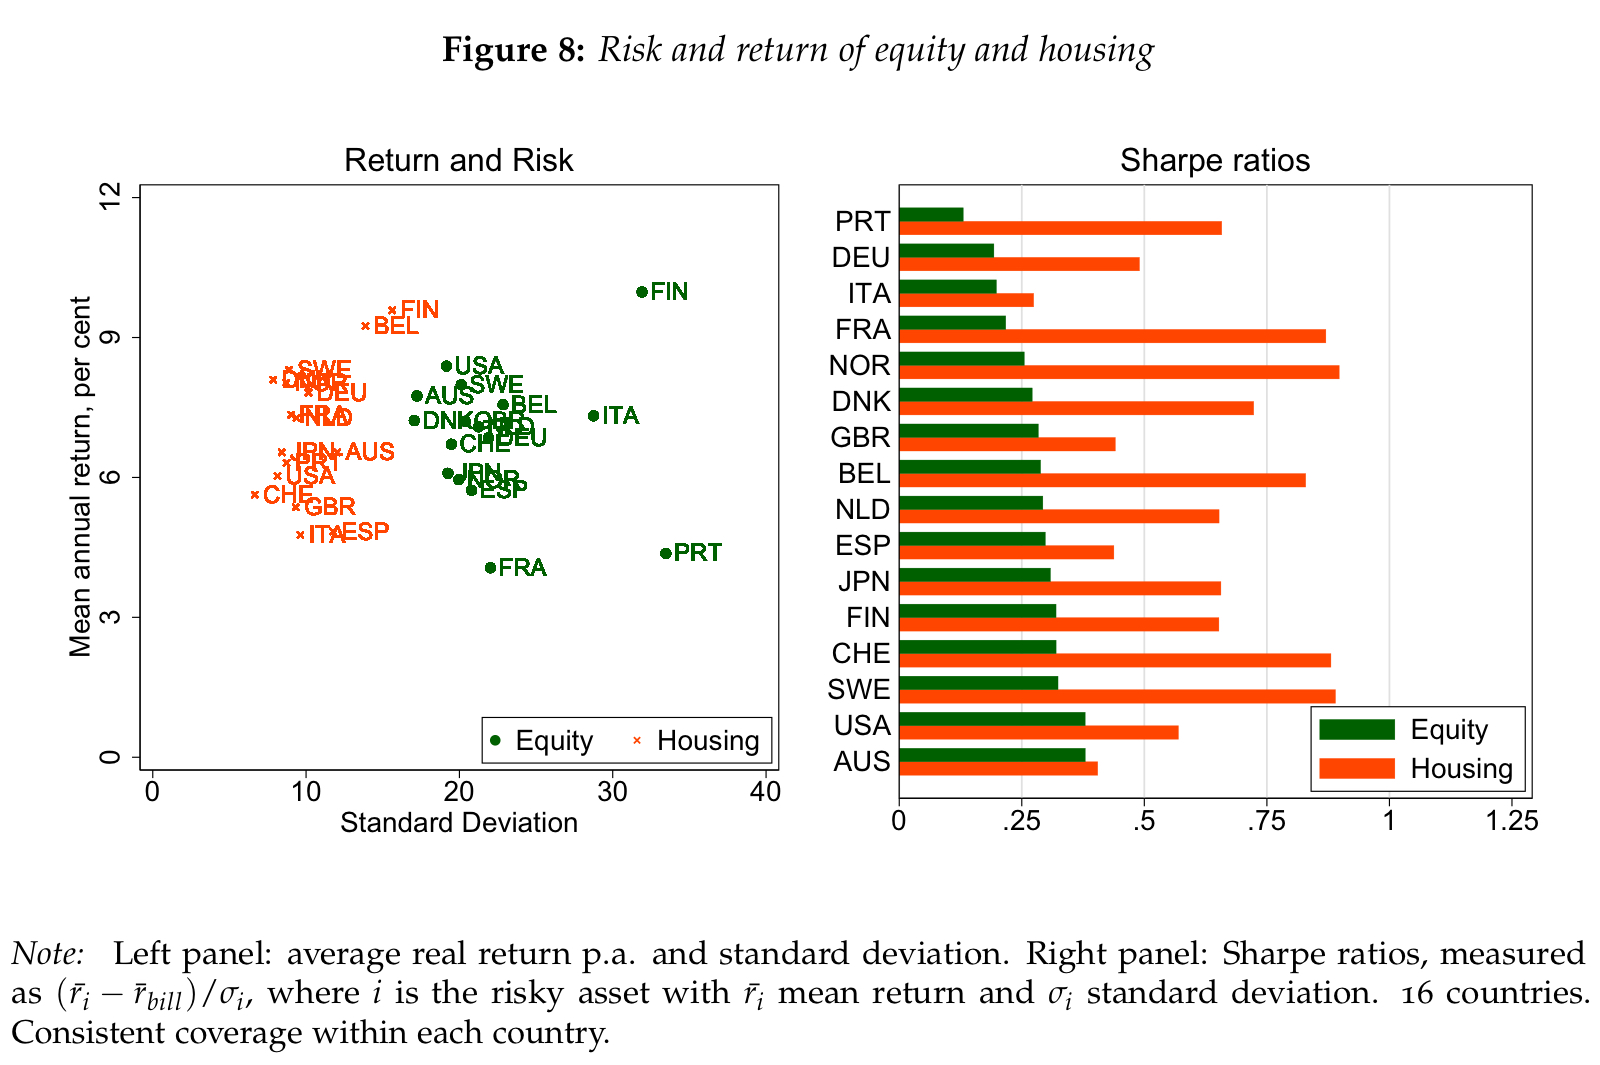
- “(…) equities do not outperform housing in simple risk-adjusted terms. Figure 8 compares the riskiness and returns of housing and equities for each country. The left panel plots average annual real returns on housing (orange crosses) and equities (green circles) against their standard deviation. The right panel shows the Sharpe ratios for equities (in dark green) and housing (in orange) for each country in the sample. Housing provides a higher return per unit of risk in each of the 16 countries in our sample, with Sharpe ratios on average more than double those of equities.” – bto: Das kann man auf dieser Abbildung sehr gut erkennen:
 Quelle: NBER Working Paper 24112
Aus Sicht des Investors stellt sich die Frage, wie man international in Immobilien diversifiziert anlegen kann. Ich denke dabei zwangsläufig an Immobilienaktien und REITS. Beides, besonders Letztere werden kritisch gesehen. Umso interessanter dieses Ergebnis der Studie:
- “Real estate investment trusts, or REITs, are investment funds that specialize in the purchase and management of residential and commercial real estate. (…) The return on these shares should be closely related to the performance of the fund’s portfolio, i.e., real estate. We would not expect the REIT returns to be exactly the same as those of the representative housing investment. The REIT portfolio may be more geographically concentrated, its assets may contain non-residential property, and share price fluctuations may reflect expectations of future earnings and sentiment, as well as underlying portfolio returns. (…) Figure 12 compares our historical housing returns (dashed line) with those on investments in REITs (solid line) in France and USA, two countries for which longer-run REIT return data are available.” – bto: Das bedeutet, dass man mit REITS (und Immobilienaktien) internationale Diversifizierung erreichen kann!
 Quelle: NBER Working Paper 24112
- Dabei vergessen die Autoren nicht ihre eigene Arbeit zum Thema Immobilienverschuldung: “(…)advanced economies in the second half of the 20th century experienced a boom in mortgage lending and borrowing. It is important to note that this surge in household borrowing did not only reflect rising house prices, but also reflected substantially increased household debt levels relative to asset values. Hence, the majority of households in advanced economies today hold a leveraged portfolio in their local real estate market. As with any leveraged portfolio, this significantly increases both the risk and return associated with the investment.” – bto: Das ist ein ganz wichtiger Punkt! Ein enormes Klumpenrisiko!
- “And today, unlike in the early 20th century, houses can be levered much more than equities, in the U.S. and in most other countries. The benchmark rent-price ratios from the IPD used to construct estimates of the return to housing, refer to rent-price ratios of unleveraged real estate. Consequently, the estimates presented so far constitute only un-levered housing returns of a hypothetical long-only investor, which is symmetric to the way we (and the literature) have treated equities.” – bto: Das bedeutet aber auch, dass die echten Eigenkapitalrenditen mit Immobilien deutlich höher waren und sind, was wiederum die ansteigenden Vermögenswerte erklärt!
- “Turning back to the trend in safe asset returns, even though the safe rate has declined recently, much as it did at the start of our sample, it remains close to its historical average. These two observations call into question whether secular stagnation is quite with us.” – bto: Also haben wir eine „normale Situation“ – naja, wenn man von der gigantischen Verschuldung absieht.
- “Interestingly, the period of high risk premiums coincided with a remarkably low frequency of systemic banking crises. In fact, not a single such crisis occurred in our advanced-economy sample between 1946 and 1973. By contrast, banking crises appear to be relatively more frequent when risk premiums are low. This finding speaks to the recent literature on the mispricing of risk around financial crises. (…) that when risk is underpriced, i.e. risk premiums are excessively low, severe financial crises become more likely. The long-run trends in risk premiums presented here seem to confirm this hypothesis.” – bto: so banal und einleuchtend!
 Quelle: NBER Working Paper 24112
Dann geht es um die Frage, ob Piketty mit seiner Behauptung, dass der Ertrag von Kapital über der Wachstumsrate der Wirtschaft recht hat. Die Daten bestätigen die Analyse von Piketty, allerdings zeigen sich immer wieder Phasen erheblicher Kapitalvernichtung:
- “(…) Piketty and Zucman (2014) argue (…) that wealth inequality may continue to rise in the future, along with a predicted decline in the rate of economic growth. The main theoretical argument for this comes about from a simple relation: r > g. In their approach, a higher spread between the real rate of return on wealth, denoted r, and the rate of real GDP growth, g, tends to magnify the steady-state level of wealth inequality.” – bto: was ich in meinem kleinen Buch über Pikettys Thesen kritisiert habe. Ich denke, es kann nicht ewig so gehen, da zum einen auch Ertrag verbraucht wird, zum anderen Verluste entstehen. Wir konnten nur wegen des Leverage-Effektes den Anstieg der Vermögenswerte möglich machen.
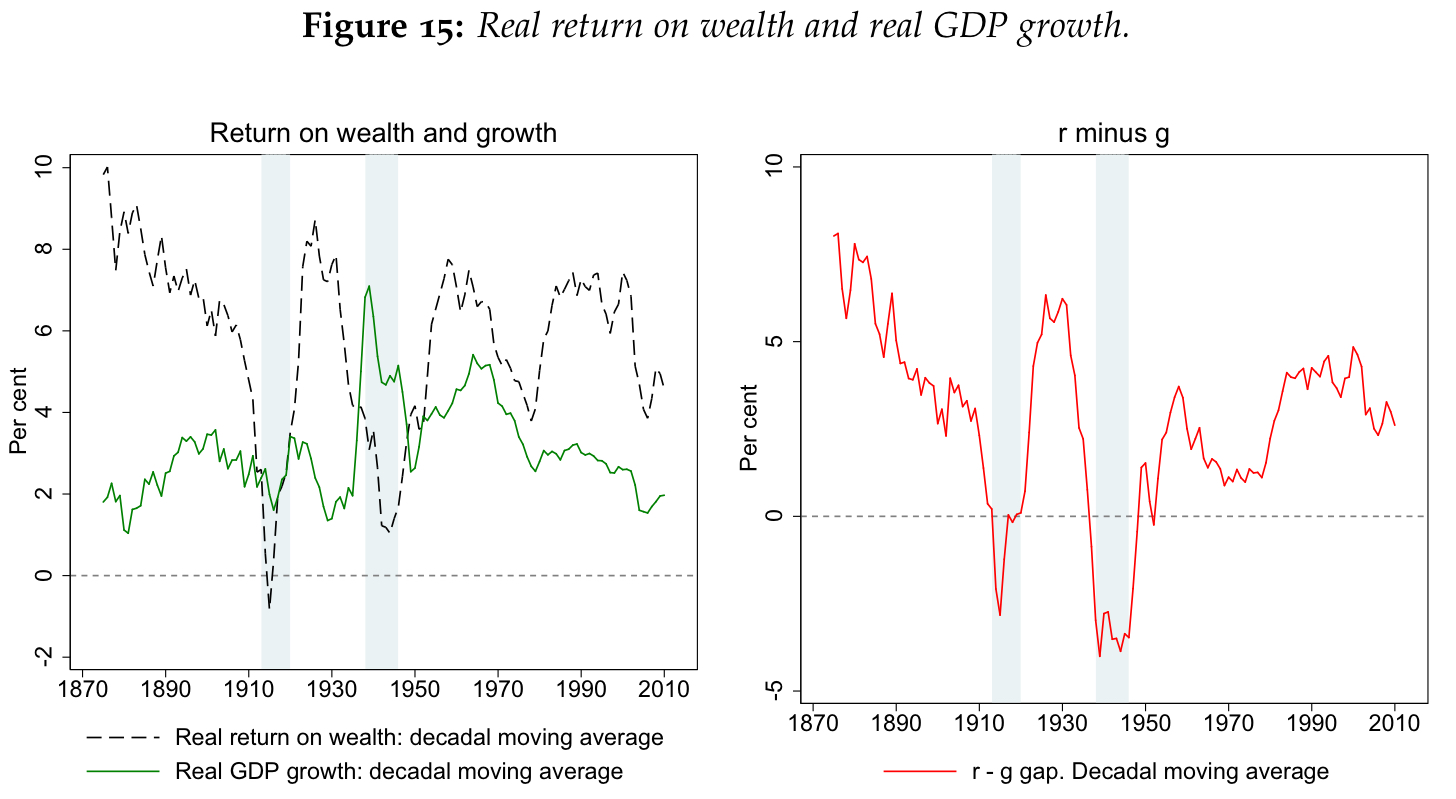
- “Our data show that the trend long-run real rate of return on wealth has consistently been higher than the real GDP growth rate. Over the past 150 years, the real return on wealth has substantially exceeded real GDP growth in 13 decades, and has only been below GDP growth in the two decades corresponding to the two world wars. That is, in peacetime, r has always exceeded g. The gap between r and g has been persistently large. Since 1870, the weighted average return on wealth (r) has been about 6.0%, compared to a weighted average real GDP growth rate (g) of 3.1%, with the average r − g gap of 2.9 percentage points, which is about the same magnitude as the real GDP growth rate itself. The peacetime gap between r and g has been around 3.6 percentage points.” – bto: Das führte aber doch zu einer Gegenreaktion, sonst wären die Vermögenswerte nicht so konstant wieder zurückgegangen.
- “(…) the initial difference between r and g of about 5–6 percentage points disappeared around WW1, and after reappearing briefly in the late 1920s, remained modest until the 1980s. After 1980, returns picked up again while growth slowed, and the gap between r and g widened, only to be moderated somewhat by the Global Financial crisis. The recent decades of the widening gap between r and g have also seen increases in wealth inequality.” – bto: und waren nur mit der Verschuldung möglich!
- “As shown in Figures 15 and 13, the returns to aggregate wealth, and to risky assets have remained relatively stable over recent decades. But the stock of these assets has, on the contrary, increased sharply since the 1970s, (…) The fact that this increase in the stock of wealth has not led to substantially lower returns suggests that the elasticity of substitution between capital and labour may be high, at least when looked at from a long-run macro-historical perspective.” – bto: Das ist meines Erachtens ausschließlich wegen der gleichzeitig erfolgten Zusatzverschuldung möglich.
 Quelle: NBER Working Paper 24112
- “Real house prices have experienced a dramatic increase in the past 40 years, coinciding with the rapid expansion of mortgage lending. (…) Measured as a ratio to GDP, rental income has been growing, (…). However, the rental yield has declined slightly — given the substantial increase in house prices—so that total returns on housing have remained pretty stable.” – bto: Diesen eindeutigen Zusammenhang sollte man zum Gegenstand der Politik machen, statt über höhere Einkommenssteuern nachzudenken. Es ist eben nur eine Folge unseres Schuld-Geldsystems.
Und hier der Link zur Studie: w24112




@Fragen zu Tabelle 5 (Uebersicht historische Rendite Aktien vs Wohnimmobilien)
Warum waren reale Renditen bis 1980 ca. gleich auf bei Aktien/Wohnimmos aber danach nicht mehr (Aktien seit dem ca 3,5% pa besser)
– Start Globalisierung: Gueter werden in immer groesserem Umfang in die weite Welt verkauft. Gewinne der nationalen Unternehmen haengen immer mehr vom Auslandsgeschaeft ab (immer weniger vom Innlandsgeschaeft)?
– Pillenknick: Bevoelkerung in Industrielaendern nimmt kaum noch zu, daempft auch die Nachfrage nach Wohnimmos? Der Kuchen wird kaum (mehr) groesser.
Fazit: Strukturbruch, bis 1980 wuchsen lokale Wirtschaft/lokale Wohnimmos im Gleichschritt. Danach immer weniger. Oder, was spricht gegen diese These?
Viel interessantere Spekulation: Wie gehen die Trends weiter?
– Wohnimmos in den entwickelten Laendern sind schon in der Breite weiter “am Ende der Fahnenstange” als Aktien angekommen?
– Wohnimmo-Cashflows sind schon viel “teurer” als Aktien-Cashflows (Dividenden) geworden?
Aber beide Assets haben wohl bereits (fuer die naechste Dekade?) die besten (Anstiegs)Zeiten hinter sich?
Wenn Glueck fuer Entsparer, dann langes Plateau; wenn Pech, dann erratisches Zurueckschwingen des Pendels?
Wenn Glueck fuer Ansparer, dann Zicki-Zacki mit Einstiegsgelegenheiten; wenn Pech dann Ansparen auf dem Plateau und Entsparen nach dem Bewertungs-Cut?
Intuitiv setze ich auf die Gesamtheit der Unternehmen, da sind alle REITs und Wohnimmo-Aktien schon inkludiert – ohne Uebergewichtung dieser.
LG Joerg
Vielleicht fuer einen weiteren Faden: die hier aufgefuehrten Renditen fuer Immobilien sind wesentlich hoeher, als zB hier: https://www.gerd-kommer-invest.de/die-rendite-von-direktinvestments-in-wohnimmobilien-besser-verstehen/ zu lesen sind. Es scheint eine grosse Kontroverse bei der Qualitaetsbeurteilung von historischen Immo-Renditen zu geben (GK verweist auf den Gold-Standard von Dimson, Marsh, Staunton). GK kommt auf 2,4% reale Rendite fuer Wohnimmos.
Er geht explizit auf das hier besprochene Paper von Jordà et al ein und kritisiert es stark.
– laut GK: SuperCity Bias: historische Daten va fuer (wenige) Grossstaedte; zu geringe Instandhaltungskosten angesetzt; den Kredit-Hebel richtig herausgerechnet? Transaktionskosten beruecksichtigt?
“Alles in allem können die der herrschenden Meinung widersprechenden Ergebnisse von Jordà et al. ohne Bestätigung anderer renommierter Forscher bis auf Weiteres nicht ernst genommen werden. Daran ändert auch nichts, dass mehrere große Zeitungen in Deutschland diese Zahlen kritiklos nachgeplappert haben.”
Eine hervorragende Studie.
Um diese Ergebnisse auf lange Dauer zu erzielen ist ein wichtiger Punkt zu ergänzen:
Der Anleger muss immer genügend freie Liquidität vorhalten, damit er in Krisenzeiten nicht verkaufen muss.
Wirklich ein sehr spannender Artikel, zu einem Thema das gerade viele Menschen (nicht nur wohlhabende) beschäftigt. Stellt sich also nun die Frage wie man aktuell sein Vermögen investieren sollte. Wenn man zum Beispiel mit einem größeren Betrag in den Aktien Markt einsteigen möchte , würde ich persönlich über eine Stückelung der Positionen nachdenken. Dann ganz klassisch in einen ETF Portfolio 70% MSCI World und 30% EM mit einer Anlagedauer von mindestens 15 Jahren. Damit sollte man doch nicht so viel falsch machen, oder irre ich mich?
@Dr. Hannes Forster
“Stellt sich also nun die Frage wie man aktuell sein Vermögen investieren sollte….
…….
-Damit sollte man doch nicht so viel falsch machen, oder irre ich mich?”
Ob sie sich irren/”irrten” …werden sie “dann” ja (in 15 Jahren) sehen/erfahren.
Die Frage nach “Investieren” bzw. VERLIEREN ist eigentlich ja sehr einfach ..aber nur SIE SELBER könne diese wirklich BEANTWORTEN.
Sprich: Sie können nach “Tiefrisiko” bzw. “alten Börsenweisheiten” investieren (ETF usw.) und “die Eier” auf verschiedene “Körbe aufteilen” oder sie investieren wie z.B. ein Hr. Taleb : 10% auf Hochrisiko (Pennystocks,Startup’s usw.) mit entsprechendem Gewinn/Verlust und den grossen Rest konservativ.. usw….
JEDE Antwort auf ihre Frage ,ist schlicht UNSERIÖS ..OHNE IHRE unzählige VORINFORMATIONEN PREFERENZEN usw. zu kennen:
z.B . Alter/Kinder/”Zukunftswünsche”/ Erwartungen/Risiko-bzw.VERLUSTbereitschaft/Einkommen bzw.”freie Mittel”/Gewinnziele usw….usw.
Mein simpler Rat an SIE und JEDEN : “Investieren” SIE ,wie ihnen SELBER am WOHLSTEN ist. Punkt.
Am Rande:
Ein guter Freund und ehemalige Arbeitskollege von Mir (Deutscher), Single bzw. jetzt Verlobt , Beruf Klempner , ehemaliger Wohnort bzw. aufgewachsen in der Region Cottbus und ein absolut “angefressener”/ bzw. “fanatischer” Angler, Naturfreund, sehr Heimatverbunden, Risikoscheu, Übergewichtig /Couchpotato usw. stellte DIESE Frage einmal (ca.2016/17) an Mich, weil er “wusste” bzw. “hörte”, dass ich “investiere”…..:
SEINE Frage (wörtlich) :
In welche Aktie oder ETF oder “Sonstiges” soll ich denn “investieren” !
Mein einfache und simple Antwort für IHN :
Kauf ein grosses Freizeitgrundstück am See (Wassergrundstück) und zwar in Deiner Region . Punkt.
Fazit:
Mein Rat hat anscheinend Anklang gefunden:
Heute ist er Eigentümer eines 1.2 Hektar Wasser-Grundstückes im Landkreis Oberspreewald-Lausitz und sein “persönlicher Gewinn” ist ,neben der materiellen Wertsteigerung, “unermesslich” (seine eigene Aussage )!
@ weico
Darf ich einfach einen Luftkicking anspringen?
Recht herzlichen Dank für die ausführliche Antwort!
Die Antwort von WEICO finde ich exzellent!
Ich gebe noch zu Bedenken, dass Wirtschaft und Börse (wie alles) in Zyklen ablaufen. Nachdem das von Ihnen genannte 70/30-System nun schon seit der Finanzkrise 2008 gut gelaufen ist, würde ich erwarten, dass es in der jetzigen Dekade das nicht fortsetzt, sondern schlechter performt als Value, insbesondere Emerging Markets, Rohstoffe und Edelmetalle.
Auch Ihnen Vielen Dank!
Ich sehe das auch so. 70 % World und 30% EM ist gut diversifiziert.
Vielmehr geht kaum noch.
LG Heppi
Freut mich das Sie es ebenfalls so sehen. Besten Dank!
Ergänzend möchte ich noch hinzufügen:
Neben geografischer Diversifikation kann man auch den Investmentstil diversifizieren.
Also ist es bspw. unbedingt ratsam einen ETF auf Small Caps ins Portfolio zu nehmen (die langfristig einfach besser laufen), auf die Momentum Strategie etc…
Auch thematische Investments wie Private Equity ETFs sind sicher langfristig nicht verkehrt, oder Biotech, um auch in solchen Bereichen konzentrieter zu investieren.
Es bleibt aber dabei: besser überhaupt investiert zu sein, als gar nicht oder nie anzufangen!
@Jacques
Ich verstehe, worauf Sie hinauswollen, aber Einsteiger dürfte dieser Vorschlag überfordern, weil die gar nicht in der Lage sind, einzelne Strategien auseinander zu halten.
Am Ende mischen die noch wahllos “Long” und “Short” ETFs und wundern sich, wieso sie keine Renditen erzieheln…
@Richard:
Völlig klar, für den Anfang too much, aber man lernt ja immer gerne dazu.
Btw es gibt mittlerweile für Privatanleger auch Leveraged ETFs ;)
In den USA ist der unter dem Ticker “TQQQ” laufende ETF fast schon legendär.
Ein 3x gehebelter ETF auf den NASDAQ, besonders beliebt bei Day Tradern.
Man achte auf die langfristige Performance! 1.200% (richtig, eintausendzweihundert Prozent!) in fünf Jahren, 15.600% seit 2010.
In der EU ist übrigens nur zweifacher Hebel für Privatanleger erlaubt.
Im September ist Bundestagswahl. Dann sollte der Wähler die Chance haben eine andere Richtung vorzugeben. Dass Sie der FDP nahestehen, bringen Sie auf Twitter öfters zum Ausdruck, aber was halten Sie von Wahlprogramm der AfD hinsichtlich Steuern, Abgaben und einem Rentenfonds nach norwegischem Vorbild?
Hopf-Klinkmüller Capital Management kommt hier zu einem sehr positiven Ergebnis, was viele überraschen dürfte.
https://www.youtube.com/watch?v=IjD0NKkOl0Y&t
@Michael+Bodenheimer
“Im September ist Bundestagswahl. Dann sollte der Wähler die Chance haben eine andere Richtung vorzugeben. Dass Sie der FDP nahestehen, bringen Sie auf Twitter öfters zum Ausdruck, aber was halten Sie von Wahlprogramm der AfD hinsichtlich Steuern, Abgaben und einem Rentenfonds nach norwegischem Vorbild?”
Die AfD-Analyse ,von Hopf-Klinkmüller Capital Management , ist sachlich und absolut gelungen.
Leider liest die Mehrheit der WÄHLER ja die PARTEI-Wahlprogramme nicht, sondern sie “informieren” sich ja hauptsächlich beim “öffentlichen” und privaten Fernsehen .
Wie absurd, tendenziös und lächerlich solche “Informationen” dann ausschauen und wie die AfD dargestellt wird, konnte man diese Woche wieder, auf ARD, sehen.
https://www.daserste.de/information/politik-weltgeschehen/kontraste/videosextern/steuern-rauf-oder-runter-fuer-topverdiener-102.html
Nebenbei:
Würde das Parteiprogramm nicht von der AFD stammen, sondern von der UNION,…wäre wohl eine absolute Mehrheit (wie 1957) möglich !
Im AfD-Wahlprogramm stehen noch ein paar andere Sachen.
Beispiele:
Verschärfung des Abtreibungsrechts,
Wiedereinführung der Wehrpflicht,
Soldatische Tugenden,
Austritt aus der EU,
der Wolf kommt auch drin vor,
die „Schmähungen“ des deutschen Kaiserreichs müssen ein Ende haben.
Kurz, eine reaktionäre, rückwärtsgewandte Partei, die so ungefähr die Bundesrepublik der 80er Jahre wiederherstellen will, eingebettet in die Staatenwelt des 19. Jahrhunderts.
Insbesondere die Besessenheit mit dem Kaiserreich regt zum Nachdenken an. Es verwundert schon, dass dieses Staatswesen des 19. Jahrhunderts eine Priorität in einem Wahlprogramm im 21. Jahrhundert darstellt.
Dieses Gebilde hatte ja noch nicht mal 50 Jahre Bestand und ist dann krachend an sich selbst gescheitert. Insofern eigentlich eher ein Beispiel dafür, wie Mannes nicht macht.
Übrigens gibt es da eine interessante Parallele. Eine der Herausforderungen im Kaiserreich war, wie man die wachsende Arbeiterschicht ins politische System integriert. Die Antwort des Bürgertums (zusammen mit dem Adel), als der Schicht, die auch die AfD zu vertreten vorgibt, war, am besten gar nicht. Stattdessen hat man es mit einer Mischung aus Unterdrückung und Bestechung versucht.
Die Gründe: die Arbeiter haben nicht die Bildung, um an der Staatsführung teilzunehmen, die können das nicht; und falls sie doch an die Macht kommen, führt das zu Umverteilung, Revolution, Sozialismus, kurz, zum Desaster.
Das Desaster ist dann ja auch eingetreten, nur eben verantwortet von eben dieser bürgerlich-adeligen Führungsschicht, die sich für so genial hielt.
Die Parallele ist, heute haben wir die ökologische Herausforderung. Also auch etwas ganz neues, für das Blaupausen nicht vorhanden sind. Wer jetzt versucht, sich da an Antworten heranzutasten, wird – der Blog hier ist ein gutes Beispiel; es handelt sich ja langsam um eine AfD-Filterblase – als inkompetent, auf Umverteilung abzielend, revolutionär abgestempelt. Und natürlich droht das Desaster.
Und natürlich würde das Desaster von AfD & Co herbeigeführt, die das Problem noch nicht einmal erkannt haben, und nicht von denen, die es wirklich angehen.
Normalerweise gilt ja der Ausdruck, aus Schaden wird man Klug.
Bei der AfD gilt: AfD -> Aus früherem Schaden dumm.
@Rolf Peter
“Kurz, eine reaktionäre, rückwärtsgewandte Partei, die so ungefähr die Bundesrepublik der 80er Jahre wiederherstellen will, eingebettet in die Staatenwelt des 19. Jahrhunderts.”
Sie sind ein wunderbares Beispiel ,wie man sich durch “öffentliche Medien” vereinnahmen lässt und ein eindrückliches Beispiel eines grünen Windräder-Bürgers, der von einer diffusen “geman angst” geprägt- und von einer “Neo-Luddismus-Strömung” durchdrungen ist.
Egal welche Partei folgendes im Programm stehen hat .Es wäre, für JEDEN freiheitsliebenden und eigenverantwortlichen Menschen, ein TOTSCHLAGARGUMENT…. um DIESE zu wählen:
Nicht umsonst steht DIES ,im AfD-Wahlprogramm , ganz am ANFANG !
“Deshalb halten wir die unmittelbare Demokratie für ein unverzichtbares Mittel, um dem autoritären und teilweise totalitären Gebaren der Regierungspolitiker Einhalt zu gebieten.
Das Volk soll die Möglichkeit erhalten, Gesetzesinitiativen einzubringen und per Volksabstimmung zu beschließen. Hierbei soll es jenseits des Art. 79 Abs. 3 GG
keine thematischen Beschränkungen geben. Die Qualität der Entscheidung der Bürger muss
gesichert werden durch einen ausgeprägten und autonomen Prozess der Willensbildung, durch Informationspflichten und -rechte und eine breite gesellschaftliche Debatte. Auch die Parlamente sollen die Möglichkeit erhalten, eine Volksabstimmung zu initiieren.”
Wie sehr diese Partei WILL, dass die Leute KEINE SCHAFE mehr sind, zeigt folgender Satz:
“Die Einführung von Volksabstimmungen nach Schweizer Modell ist für die AfD nicht verhandelbarer Inhalt jeglicher Koalitionsvereinbarungen und beinhaltet insbesondere folgende Elemente:”
Schafe erkennen solches natürlich NICHT . Aber Menschen die NACHDENKEN, erkennen sicherlich ,dass mit SELBSTBESTIMMUNG ALLES möglich ist.
Nebenbei:
Leuten wie ihnen empfiehlt sich, als “Augenöffner”/Information/Angstbewältigung usw. , folgende (leichte) Lektüre (man beachte die Bewertung) :
https://www.amazon.de/GRÜN-DUMM-Natur-Narren-halten/dp/B08B38YJY3
@Rolf Peter
Ich finde es ja ausgesprochen lustig, dass Sie die von Ihnen ungeliebte böse Partei als “reaktionär und rückwärtsgewandt” bezeichnen weil sie nicht bei der Deindustrialisierung von (Achtung, nicht erschrecken!) Deutschland und der Abschaffung einer grundlastfähigen Stromversorgung “fürs Klima” mitmachen will.
Dabei hatten wir solche Zustände zuletzt vor 1850.
Thema ist: “Langfriststudie – Globales Immobilienportfolio und Aktien die beste Geldanlage”. Wieso wird hier über das Parteiprogramm der AfD philosophiert? Ah, verstehe … “global” diesmal, beim letzten Mal war’s nur der Osten. Höcke der Globalist und seine global denkenden Freunde werden’s richten, wenn die Wahl sie trifft.
@JürgenP
“Höcke der Globalist und seine global denkenden Freunde werden’s richten, wenn die Wahl sie trifft”
Globales “Denken” bzw. globale “Weltrettung ” gehört wohl eher ins “Denkgebilde” einer Annalena Charlotte Alma Baerbock…und ihren Umverteilungsgenossen.
@ Rolf P.:
Das Kaiserreich war eine Zeit, in der sich Deutschland aus dem Mittelalter zur führenden Wirtschafts- und Wissenschaftsnation emporgearbeitet hat. So schlimm wie Sie es darstellen, kann es wohl nicht gewesen sein.
Als Gründe dafür sehe ich allerdings auch nicht den tollen Kaiser, sondern eine stabile Goldwährung und eine liberale Verfassung mit hoher Dezentralität.
Was die Arbeiter angeht, gebe ich Ihnen zwar Recht, aber das war zu der Zeit ein “globales Problem”. Und in Deutschland ging man mit den Arbeitern vergleichsweise gut um, was wiederum ein Verdienst des Kaisers war.
Vielleicht sollten Sie noch einmal neutrale Quellen, am besten aus dem Ausland, bemühen.
@weico 18:11
Oh je, dieser Vergleich, sind mal wieder die Pferde mit Ihnen durchgegangen … Björn H plant die Welt zu erretten, vom Bösen zu befreien. Anna B möchte sie auch vom Bösen befreien, dem fiesen Gas. Letzteres ist doch nun wirklich nicht schlimm.
@ Michael + Bodenheimer
>… sollte der Wähler die Chance haben eine andere Richtung vorzugeben>
SOLLTE?
Der Wähler hat nicht nur die Chance im Sinne einer Wahrscheinlichkeit, sondern auch die REALISIERBARE Möglichkeit, eine andere Richtung vorzugeben.
Es wird KEINE Richtungsänderung geben.
Die Mehrheit wird aller Voraussicht nach die Richtung BESTÄTIGEN, nämlich verstärkte Energiewende und Umverteilung.
@DT
“Es wird KEINE Richtungsänderung geben.
Die Mehrheit wird aller Voraussicht nach die Richtung BESTÄTIGEN, nämlich verstärkte Energiewende und Umverteilung.”
Diese Meinung teile ich ,kurzfristig gesehen ,ebenfalls.
Man bzw. ich sehe aber auch die “positiven Seiten” dieser Richtung.
Die momentane Richtung ist zwar zum Nachteil von Deutschland ….aber wiederum sehr zum Vorteil meiner Investition !
@ bto:
…….. wer kann sich die hohen mieten, mittel und langfristig, noch leisten?
d.h. die miet-renditen werden sinken. und dies bei steigenden neu-umbau-erhaltungskosten der immobilie.
eine desaströse zwickmühle, welche sch laufend zuspitzt, – dank diesen schuldgeldsystem!
miete und der übliche konsum sind neben der arbeit, riesige umverteilungsmechanismen zu gunsten des großkapitals.
sind wir (die masse) nur auf der welt um zu arbeiten und zu konsumieren? und,
wenn unsere arbeits- und konsumleistung nicht mehr ausreicht, dem system die gewinne zu erwirtschaften, dann droht uns
-enteignung nahezu allen besitzes, durch dikatorische maßnahmen
– coronaplandemie, als mittel zum zweck?
-krieg und zerstörung
ist das der sinn des lebens für die masse? ja dazwischen darf man noch etwas freude entwickeln!
dieses geld- und wirtschaftssystem endet stets in der wiederholung: aufbau und zerstörung
und warum hatlen wir an diesen system fest ??
Der Mensch ist ein Herden- und Gewohnheitstier. Hat er einen guten Schäfer, ist das kein Problem.
Aber gute Schäfer sind rar.
@Felix
“Der Mensch ist ein Herden- und Gewohnheitstier. Hat er einen guten Schäfer, ist das kein Problem.
Aber gute Schäfer sind rar.”
Aber …
…es gibt AUCH viele Herdentiere ,die KEINEN Schäfer brauchen .
Viel haben es halt nur verlernt bzw. nie gelernt, dass es auch OHNE geht.
Eine Herde kann sich, wie es die Natur ja vorlebt, problemlos SELBER organisieren.
@weico
Der Wunsch nach einem ” guten Hirten” basiert auf frühkindlichen Ängsten und Bedürfnissen, je infantil-abhängiger eine Gesellschaft bleibt, / gehalten wird/ um so süchtiger nach ” Führern”/ HIrten. Geniale Selbstorganisation von z.B.Vogleschwärmen wird erforscht, ein Naturschauspiel- 20 Starenkästen für Brutpaare waren genug, um Zugschwärme im Herbst anzuziehen, übernachten in Schilf und hohen Bäumen, Gezwitscher bis tief in die Nacht:
https://www.youtube.com/watch?v=jfoykcmi29E
:führerlose Eleganz und -Organisation.
@Dr. Lucie Fischer
In einer Herde hat jedes “Schäfchen” einen Namen. Das ehemalige “UK-Schäfchen” wird sicherlich auch bald seinen Namen verlieren.
https://www.bpb.de/cache/images/3/283443-st-galerie_gross.jpg?0EEC0
Nebenbei:
Müssen ja nicht immer “Schäfchen” sein. Bei Bertold Brecht waren es ja KÄLBER !
Sein Lied :”DER KÄLBERMARSCH”…ist passend für die heutige Zeit !
@weico
“…es gibt auch viele Herdentiere, die keinen Schäfer brauchen.”
Das ist richtig, führt in der Analogie aber doch fehl.
Eine Herde hat eine Alpha-Wölfin, eine Leitbache, ein Leittier (Rot-/Damwild) usw. D.h. jemandem aus dem eigenen Verbund, der die FÜHRUNG übernimmt, Gefahren erkennt, warnt und zu üppigen Weiden (gelegentlich auch Mülleimern, Abfallbergen) führt.
Im Übrigen sind diese Führungstiere häufig weiblich, während die erfahrenen (=alten) männlichen Stücke eher grummelnd und auf Krawall gebürstet unterwegs sind. 😉
Herde oder nicht?
ME zeigen diverse Experimente, dass die Mehrheit der Menschen absolute Herdentiere sind, in dem “bösen” Sinne, dass sie sich eben nicht selbst vernünftig organisieren können. In einer gebildeten, liberalen Gesellschaft haben wir bisher erreicht, dass sich etwa 30% der Bevölkerung selbständig sinnvoll verhalten können. Aktuell sehe ich uns unter diesem Wert.
Ich halte es aber für möglich, dass eine Gesellschaft einen größeren Teil der Bevölkerung aus der Unmündigkeit herausführt. Durch gute Bildung und klassische Tugenden. Ich kann aber nicht erkennen, dass dies bei uns die Agenda wäre. Bestenfalls braucht man gute Betas, oder?
Der Bezug zu Verhaltenswissenschaften und deren realer Praxis sind der Schlüssel zu den aktuellen singulären beispiellosen Entwicklungen gegen die Natur der Menschen, denn die Verachter unserer Spezies haben das Bösartige in Menschenversuchen in schlimmster Vorsätzlichkeit studiert, geplant, umgesetzt und werden brutal bis zur Aussrottung von Milliarden Erdenbewohnern handeln – sie machen das alternativlos, weil ansonsten ihre vollständigeEntfernung aus der Öffentlichen Sphäre auf sie wartet.
Und es ist absehbar und gerecht, was immer ein Mensch dazu definiert, er handelt in Verantwortung lebend!
Wir sind dann mehr Rudel als Herde. Die Kunst ist es, viele Rudel auf engen Raum friedlich bleiben zu lassen und zu kontrollieren. Wobei die Heiratsregeln der Kirche (am Höhepunkt bis in den achten Verwandtschaftsgrad verboten) dem Rudel (Stamm, Clan, Sippe, etc) bei uns (mit) den Garaus gemacht haben. Eine Voraussetzung für viele staatliche Institutionen, weil man es eben nicht mehr intern regeln kann. Vielleicht ein Grund, warum die Menschen Identität in der Nation suchen (müssen).
@ Namor 20.52
Interessanter Gedanke. Die Menschen haben bisher drei grundsätzliche Phasen durchlaufen, mit denen sich unsere Ethik vollkommen verändern mußte. Ihr Clan (Sippe, Stamm etc.) stammt aus der ersten Phase der Jäger und Sammler, hier und da noch Hirten. Da mußte ein Mann seinen Mann stehen. Durch Jagd und Kampf starben viele und ein Mann mußte mehrere Frauen bespaßen. Danach gingen wir zur Landwirtschaft über. Diese Gesellschaften hatten ein ausgeglichenes Verhältnis von Männern und Frauen und nun wurde Monogamie erforderlich, um einigermaßen friedlich durch den Alltag zu kommen. Aus der Zeit stammt ihre kirchliche Regelung. Zuletzt kam die Industriegesellschaft, die die bisherige Monogamie nebst früher Heirat überflüssig machte. Ich kann nicht erkennen, dass die Digitalisierung die Industrie überflüssig macht.
@felix
Es ist kompliziert! Die Heiratsregeln wurden über 1000 Jahre hinweg sukzessive verschärft. Im Buch “Who we are and how we got here” ist beschrieben, wie das Kastensystem Indiens kleine Verbünde (Rudel) über tausende von Jahren fast hermetisch (sic!) von genetischer “Verunreinigung bewahrt” hat. Landwirtschaft und Zivilisation alleine ist nicht hinreichend um genetisch bedingte “Rudel” zu eliminieren. Inzucht wird auch von der Who thematisiert, zb, dass Migranten aus Westasien in Europa noch mehr dazu tendieren, als in ihren Heimatländern, vermutlich, da im Westen die Auswahl an in Frage kommenden Partnern geringer ist, als im Herkunftsland.
Stämme, Sippe, etc. sichern in vielen Teilen der Welt die Existenz auch und vor allem gegen andere Verbände. Eine Gesellschaft, wie wir das Wort verwenden, kann sich dort absehbar nicht herausbilden und deshalb ist jeder Versuch zur Demokratie vergebens. Der gefeierte Arabische Frühling war für freie Geister von Anfang an keine Hinwendung zur Moderne. Die Medien haben nur gefeiert, um die Legitimation zur Unterstützung der syrischen Rebellen zu liefern und Lybien ins Chaos zu stürzen. Alles verlogen, kommt es in den Nachrichten, dann nur um zu Manipulieren.
@ Namor 10.14
Die Epoche der Landwirtschaft hat sich zeitlich sehr lange gehalten und sich dadurch immer weiter spezialisiert. Dann wird es natürlich auch immer komplexer. Wo es heute noch “Stämme” als dominante Organisationsform gibt, hat diese Revolution nie richtig stattgefunden oder wurde wieder destabilisiert. Die Frage der “Rassenreinheit” ist ein paralleles Phänomen. Es gab immer Völker, die davon ausgingen, dass sie die Reinheit ihrer Rasse behalten müssen, um ihre Kultur zu erhalten. Aus Sicht eines erfolgreichen Eroberers ist das auch logisch. Heute hängt an diesen Vorstellungen im Westen natürlich ein Giftsymbol, aber das Urteil der Geschichte ist dazu nicht eindeutig. Es gab auch Mischungen, die sich als sehr erfolgreich erwiesen haben.
Nach meiner persönlichen Meinung, werden viele im deutsche Immobiliensektor hart auf die Schnauze fallen.
Nicht jetzt, nicht in 2 Jahren, aber über die nächsten 15-20 Jahre.
Der Markt ist so absurd teuer, wo mittlerweile für Bruchbuden mit immensen Sanierungskosten Rekdordsummen aufgerufen werden.
Kaufpanik allerorten, an jedem Tischgespräch redet man über Immobilien, Trends werden extrapoliert.
Naive Privatkäufer vergleichen ihre Annuität mit der Miete, keiner denkt an Instandhaltungs- und Erneuerungskosten, obwohl Mieten in 75% aller Landkreise deutlich billiger ist als Kaufen (wegen der Preise), will man trotzdem unbedingt kaufen.
Die zukünftigen Rentner in den Ballungsräumen können sich bei Renteneintritt ihre Miete sowieso nicht mehr leisten.
Es bleibt spannend.