Die Bewertung ist das entscheidende Kriterium für den Anlageerfolg
2019 war ein hervorragendes Jahr an den Börsen. Trotz Trump, trotz Handelskrieg, trotz Abkühlung der Wirtschaft. Wir alle danken den Notenbanken für ihren großartigen Einsatz. Okay, es gibt einige Miesepeter wie die Bank für Internationalen Zahlungsausgleich, die versuchen die Stimmung zu trüben:
→ Hussman: “The Meaning of Valuation”, Dezember 2019
Da gibt es Sorgen vor zu hohen Bewertungen und wegen fehlenden Risikobewusstseins der Investoren. Auch der Blick in die Geschichte mahnt zur Vorsicht. Folgen doch auf gute Jahre meist ein schlechtes:
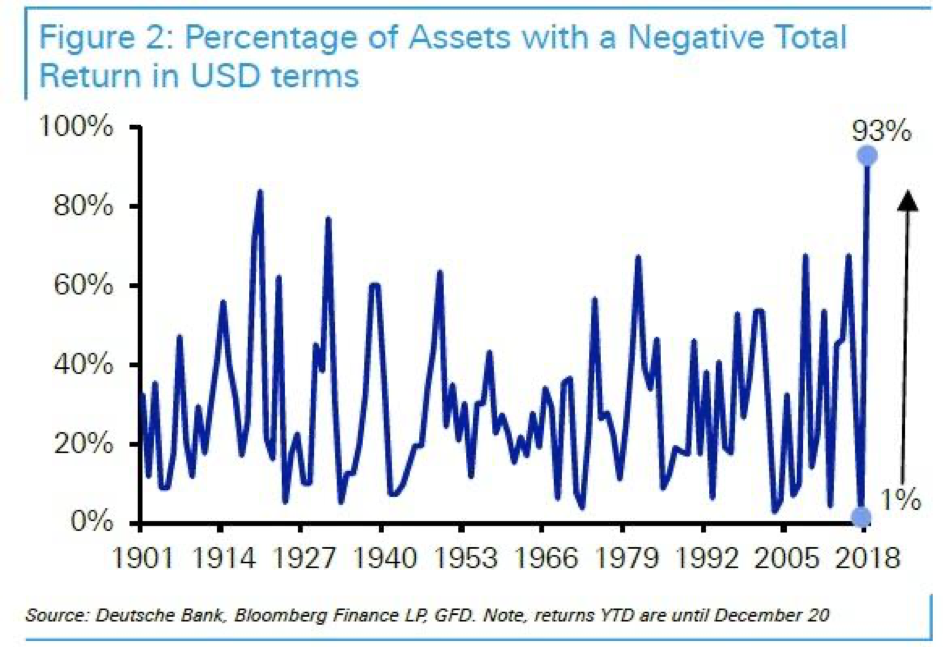
Quelle: Deutsche Bank
Es lohnt wirklich, das Bild anzuschauen. 2020 muss demnach ein schlechtes Jahr werden. Im Schnitt. Bestimmt wird es irgendwelche Nischen geben, die gut laufen.
Die US-Börse kann dazugehören. Es ist aber eher unwahrscheinlich, wenn wir uns John Hussman anschauen. Ja, er warnt schon lange vor den Märkten. Ja, bisher ist es doch gut gegangen. Ich finde dennoch richtig, die Analysen zu betrachten. Denn sie sind sehr überzeugend:
Er beginnt mit einem Zitat von Irving Fisher aus dem Jahr 1929: “Stock prices have reached what looks like a permanently high plateau. – Professor Irving Fisher, October 15, 1929.” Immer, wenn ich das lese, muss ich gestehen, dass Fisher mir leidtut. Nicht nur hat er fast sein ganzes Vermögen im Zuge des Crashs verloren, er hat auch seinen guten Ruf für den Rest seines Lebens und wie wir sehen, darüber hinaus verloren. Dabei dürfte er bis heute jener Ökonom sein, der am besten verstanden hat, wie solche durch Margin Calls ausgelöste Krisen ablaufen.
Hier zusammengefasst: → Deflationsspirale in Zeitlupe
Doch kehren wir zurück zu Hussman, der es sich nicht verkneifen kann, auf diesem historischen Irrtum von Fisher herumzureiten. So zitiert er die New York Times vom Tag, nachdem Fisher sich so geäußert hat: “After discussing the rise in stock values during the past two years, Mr. Fisher declared realized and prospective increases in earnings, to a very large extent, had justified this rise, adding that ‘time will tell whether the increase will continue sufficiently to justify the present high level. I expect that it will (…) While I will not attempt to make any exact forecast, I do not feel that there will soon, if ever, be a fifty or sixty-point break below present levels such as Mr. Babson has predicted.’ (…).” – bto: Hier kürze ich etwas, um “Mr. Babson” zu erklären. Der war nämlich ein prominenter Mitbewerber von Fisher im Geschäft der Vorsagen und wie die FT so gut beschreibt durchaus erfolgreicher. Vor allem sagte er den Crash von 1929 voraus: “On September 5 1929, Babson made a speech at a business conference in Wellesley, Massachusetts. He predicted trouble: ‘Sooner or later a crash is coming which will take in the leading stocks and cause a decline of from 60 to 80 points in the Dow-Jones barometer.’ (…) On October 29, the great crash began, and within a fortnight the market had fallen almost 50 per cent.” – bto: was natürlich ein großer Erfolg war und ihn noch populärer machte. Dabei erging es Babson wie allen “Crash-Propheten”: “And Babson had indeed been wrong for many years during the long boom of the 1920s. People taking his advice would have missed out on lucrative opportunities to invest.”, hält die FINANCIAL TIMES (FT) fest.
→ FT (Anmeldung erforderlich) “How to see into the future”, 5. September 2014
Doch kommen wir zurück zu Hussman und die Gegenwart: “Yes, a two-thirds market loss seems severe, but in the context of 1929 valuation extremes, it was also fairly pedestrian. The first two-thirds loss merely brought valuations to ordinary historical norms. The problem was that additional policy mistakes contributed to a Depression that wiped out yet another two-thirds of the market’s remaining value. The combination, of course, is how one gets an 89% market loss. Lose two thirds of your money, and then lose two thirds of what’s left.” – bto: Aber diese Politikfehler würde man ja heute nicht wiederholen … SCHERZ!
“The chart below shows our Margin-Adjusted P/E (MAPE), which is better correlated with actual subsequent market returns than price/forward operating earnings, the Shiller CAPE, the Fed Model and numerous alternative measures. (…) As I’ve demonstrated a thousand ways, regardless of the impact of speculation or risk-aversion over shorter portions of the market cycle, the higher the level of market valuations, the lower the long-term and full-cycle market returns that have ultimately followed. Notably, both of these measures presently match or exceed their 1929 extremes.” – bto: Es ist banal, was es nicht weniger richtig macht. Es ist nur ein Problem des Timings. Wenn die Bewertungen hoch sind, sind die künftigen Erträge tief.
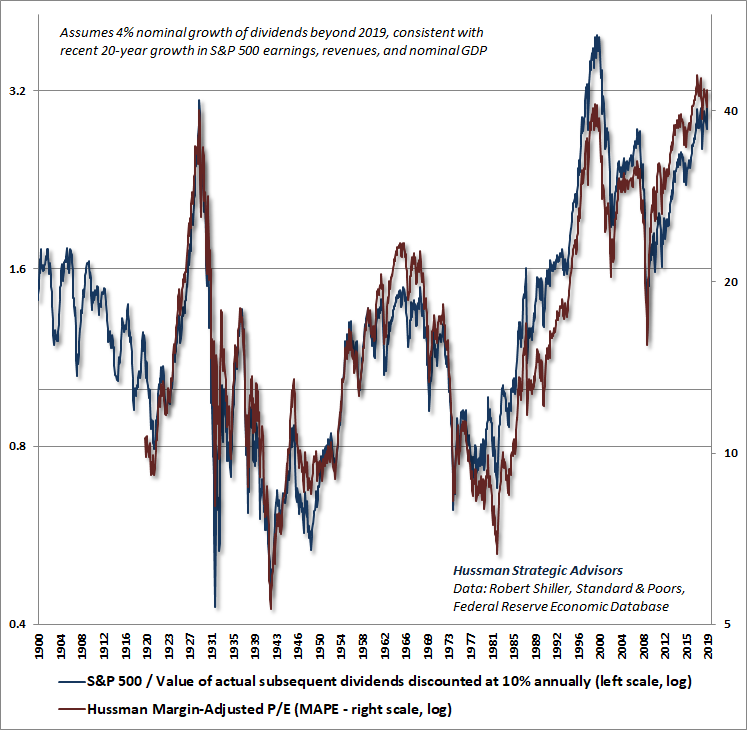
Quelle: Hussman
“Based on the most reliable valuation measures we’ve examined or introduced over more than three decades, the current tradeoff between stock prices and likely future cash flows now rivals the 1929 and 2000 extremes. (…) Indeed, the most reliable valuation measures suggest that stock prices are presently about three times the level that would imply future long-term returns close to the historical norm. That may sound like a preposterous assertion, but we’ve seen such extremes before, and they’ve ended quite badly.” – bto: Nur diesmal ist es die “Alles-Bubble”, die platzt.
“Worse, there is a great deal of evidence to support the assertion that interest rates are low because structural economic growth rates are also low. In that kind of environment, a proper discounted cash flow analysis would show that no valuation premium is “justified” by the low interest rates at all. Hiking valuation multiples in response to this situation only adds insult to injury.” – bto: Das ist in der Theorie auch so. Zinsen widerspiegeln demnach die Erwartungen für künftiges Wachstum. Es lohnt, darüber nachzudenken! Ja, ich habe an anderer Stelle jene kritisiert, die die Notenbanken in Schutz nehmen. Wie passt das zusammen? Meiner Meinung nach so: Die Notenbanken haben nicht nur den Marsch in die Schulden befördert, sondern auch die Zombifizierung, die entscheidend dazu beigetragen hat, das Wachstum zu dämpfen.
“Last week, our estimate of prospective 12-year nominal annual total returns on a conventional portfolio mix (invested 60% in the S&P 500, 30% in Treasury bonds, and 10% in Treasury bills) fell to the lowest level in U.S. history, plunging below the level previously set at the peak of the 1929 market bubble. The chart below shows these estimates (blue), along with the actual subsequent12-year total returns that have followed (red).” – bto: Das ist eine sehr einleuchtende Analyse:
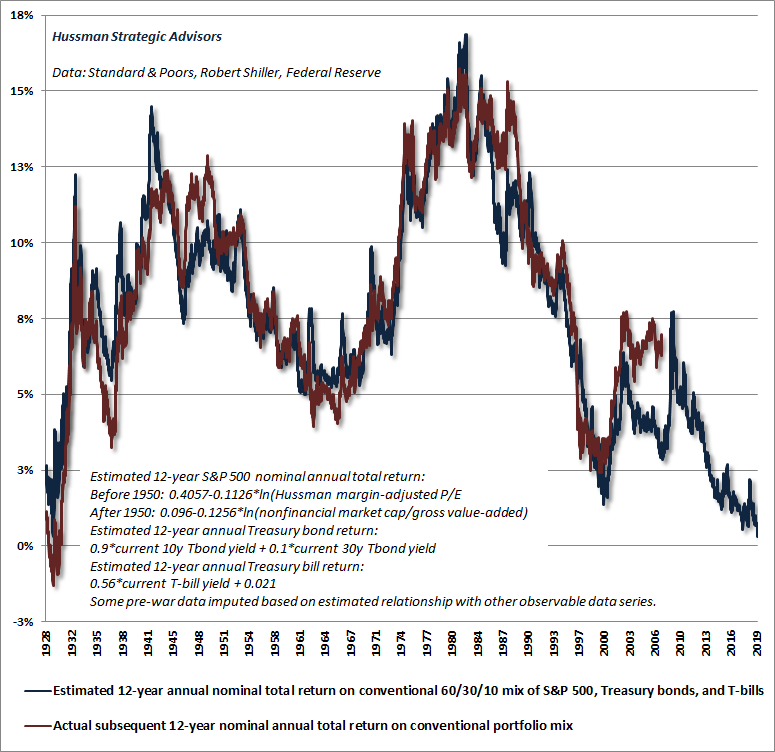
Quelle: Hussman
“During the midst of the 2000-2002 bear market, Warren Buffet gave an interview in Fortune magazine, observing that ratio of stock market capitalization to GDP ‘is probably the best single measure of where valuations stand at any given moment.’ (…) At present, that ratio is even more extreme than at the 2000 peak.” – bto: Buffet hält zurzeit auch einen Rekordbestand an Cash, er wartet wohl auf günstigere Einstiegsmöglichkeiten.
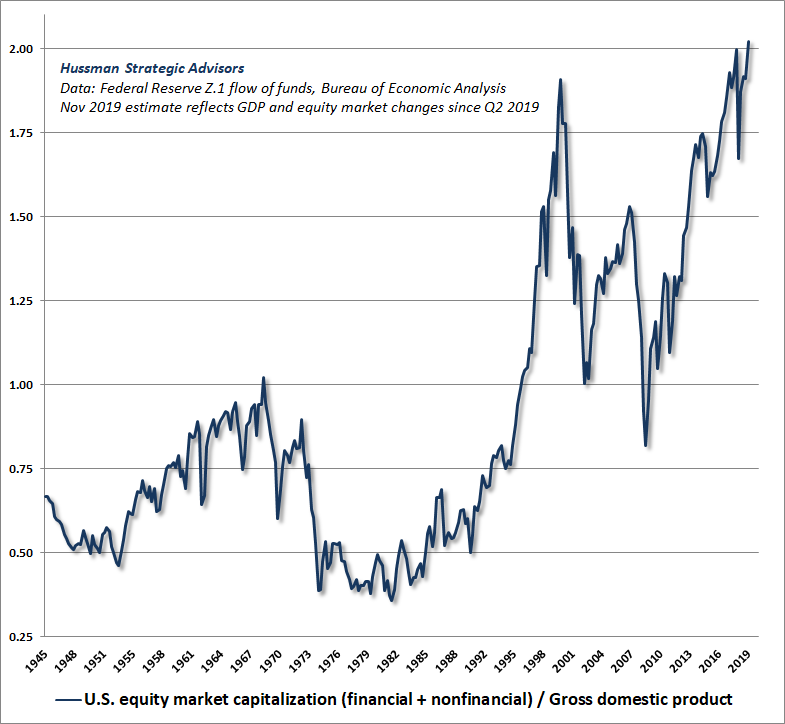
Quelle: Hussman
“Below is a scatter of the most reliable measure we’ve studied or introduced: nonfinancial market cap / gross value-added (including estimated foreign revenues). The axis is scaled to correspond to current levels on the S&P 500. At present market levels, we expect the S&P 500 to produce negative total returns over the coming 12-year period.” – bto: Das muss kein Crash sein. Es kann auch einfach eine lange Periode der Underperformance sein.
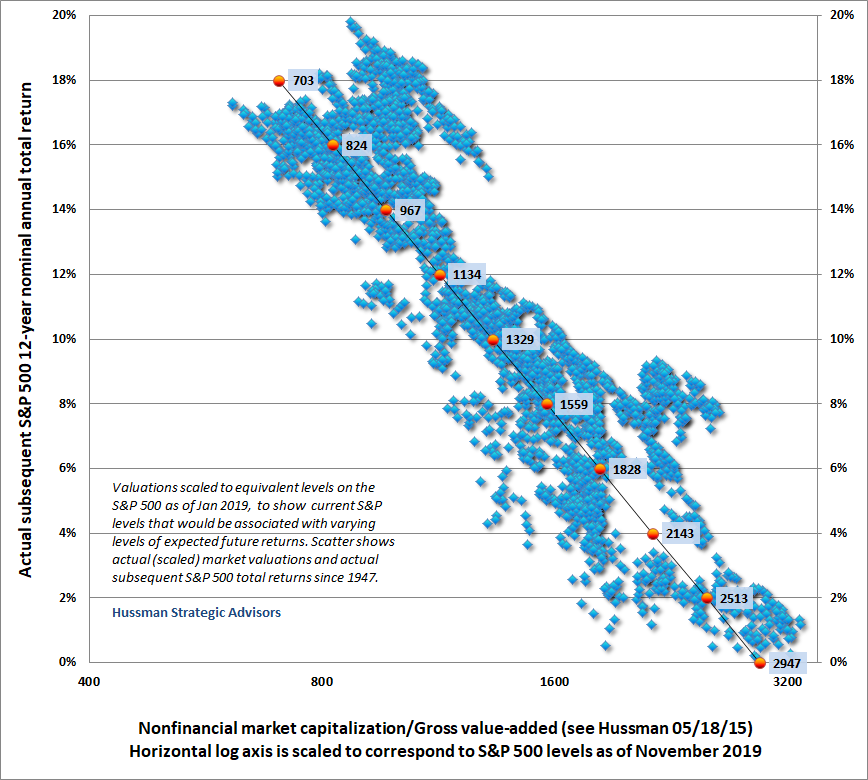
Quelle: Hussman
Permanently high plateaus
“(…) the sense of a ‘permanently high plateau’ has marked every bubble extreme in history. Yet if one studies (or lived through) the market extremes in 1929, 2000, and 2007, there was a general sense – occasionally expressed but then immediately dismissed – that the markets were extreme, accompanied by various arguments – like Irving Fisher’s – that the elevated valuations were ‘justified’ by one thing or another. It was only in hindsight, after those bubbles collapsed, that the preceding speculative episodes were commonly understood as ‘nuts.’ – bto: Und so wird es auch diesmal sein. Wir durchleben eine “Alles-Blase” und das hat entsprechende Konsequenzen. Es ist einfach nicht davon auszugehen, dass diese Verzerrung dauerhaft bestehen bleibt, noch dass sie sich geräuschlos auflöst.
“(…) the divergence of the broad market from the capitalization-weighted indices can be observed in very simple ‘participation’ measures like the percentage of stocks that remain above their own respective 200-day moving averages. The chart below (h/t barchart.com) shows how participation has lagged during the recent blowoff advance.” – bto: Klartext, es fehlt dem Markt an Breite und das ist ein Warnsignal erster Güte. Es ziehen nur ausgewählte Werte den Markt:
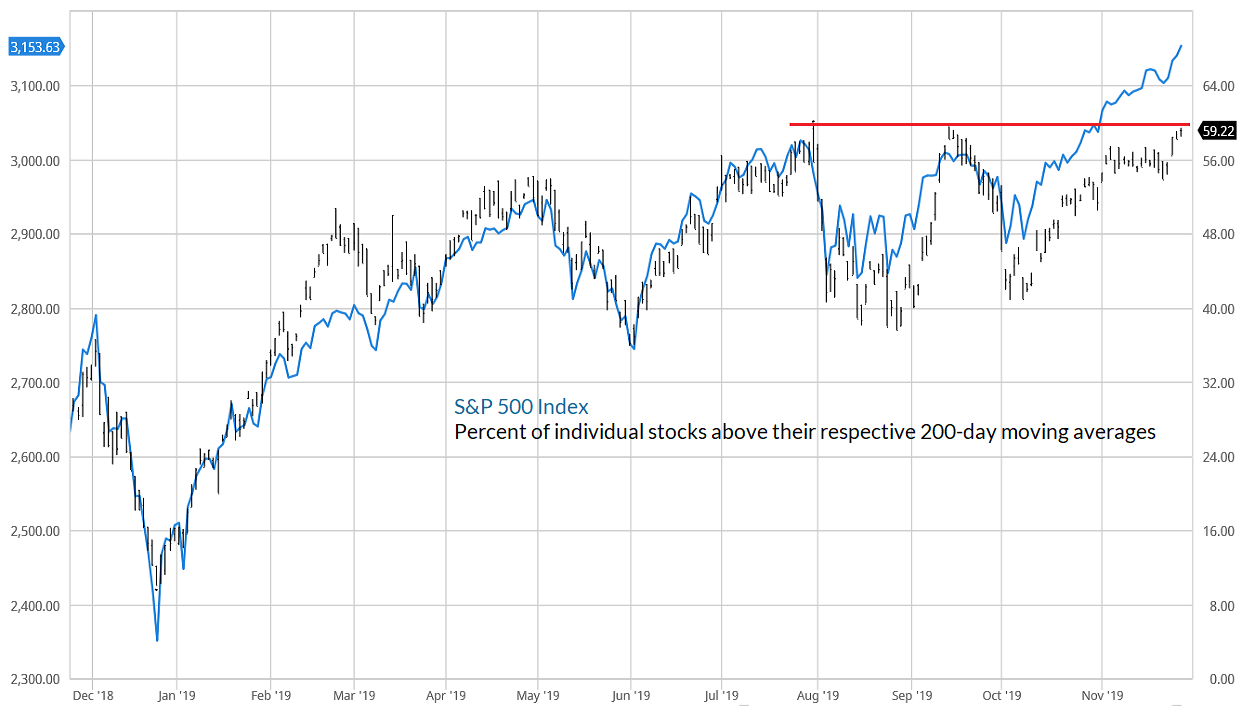
Quelle: Hussman
“While we can’t rule out a ‘Japan-like’ situation of low GDP growth and even low interest rates in the years ahead, one shouldn’t imagine that this would imply decades of ‘market stagnation without a meaningful pull-back in prices.’ Yes, Japan cut interest rates persistently and aggressively throughout the 1990s and has kept them low ever since. Yes, the median short-term interest rate in Japan since 1990 has been less than one-quarter of a percent. But stock market investors should also remember that Japan’s Nikkei stock index lost over 60% from 1990-92, with a 40% loss from 1996-98, a 60% loss from 2000-03, and a separate 60% loss from 2007-09.” – bto: einfach deshalb, weil man die Wirtschaft nicht aus der Eiszeit führen kann.
“The idea that low interest rates somehow put a ‘floor’ under stock prices is a historically-uninformed delusion. A market loss on the order of 60% would be wholly consistent with low interest rates and easy monetary policy, especially at the valuation extremes we observe at present. Recall that the Fed eased aggressively through the entire 2000-2002 and 2007-2009 market collapses.” – bto: Es ist gut möglich, dass wir das 2020 wieder erleben können.
→ hussmanfunds.com: “The Meaning of Valuation”, Dezember 2019


