Zur abnehmenden Wirkung von Schulden
Es ist unstrittig, dass wir angesichts der Corona-Krise vor einem wahren Tsunami “an fresh money” stehen. Grund genug, um einmal in das Archiv zu blicken und zu fragen: Wie hat denn das Geld früher gewirkt? Natürlich muss jetzt alles getan werden, um eine neue Krise zu verhindern. Aber eine Lösung der zugrunde liegenden Probleme unserer Schuldenwirtschaft ist es natürlich nicht.
Zunächst der Blick auf die Entwicklung der globalen Geldmenge und die damit verbundenen Risiken, VOR der heutigen Krise:
- “(…) business conditions outside the U.S. have significantly disappointed thus far in 2018.Europe’s growth has abruptly slowed and Japan’sGDP contracted in the first quarter. China’s GDPgrowth rates remain at historically low levels and, in May, China experienced the slowest year- over-year growth in retail spending in fifteen years. Additionally, numerous problems have arisen in key emerging markets including Brazil, Argentina, South Africa, Turkey and others. These developments are reflective of a noticeable deceleration in monetary expansion and the debilitating impact of high debt levels.” – bto: weil ein immer größerer Teil der Liquidität zum “Zeigen” von Zinszahlungen verwendet wird.
- “All major central banks around the world – the Federal Reserve (Fed), the European Central Bank (ECB), the Bank of Japan (BOJ) and the People’s Bank of China (PBOC) – are simultaneously presiding over a significant contraction in their respective M2 year-over-year growth rates. The reduction in growth of the U.S. reserve, monetary and credit aggregates, alongwith a major flattening in the yield curve, has been followed by weaker M2 growth in China, the euro area and Japan. Part of this impact is captured bythe concept of world dollar liquidity.” – bto: Es ist auch eine globale Geldmenge, da es in der heutigen Zeit förmlich über den Globus schwappt.
- “(…) world dollar liquidity, (…) is the sum of the U.S.monetary base and Treasury securities owned by foreign central banks held at the Federal Reserve Bank of New York (Chart 1). This measure, which was expanding at nearly a 21% growth rate from 2009-2014, has dramatically shifted its trajectory to essentially no expansion from 2015 to May 2018. Thus, by tightening monetary conditions domestically, the Fed also drained liquidity globally.” – bto: Und das erklärt auch, weshalb es an den Finanzmärkten turbulenter wird. Es fehlt das Schmiermittel.
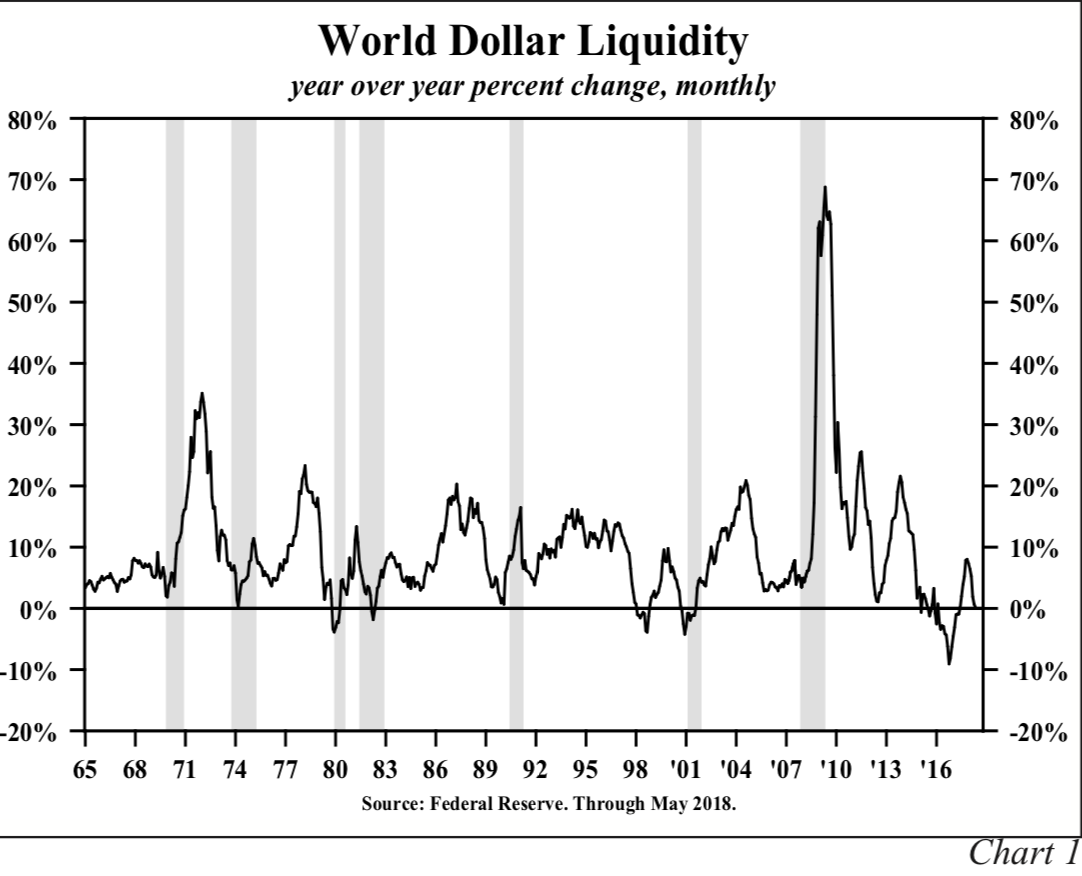
Quelle: Hoisington
- “On a year-over-year basis, euro area M2 growth peaked slightly below 7% in mid- to late 2015, less than a year after the end of the Fed’s third and final quantitative easing program (QE). Since late 2015, M2 growth slowed to 5.2% for the 12 months ending September 2017 and then saw an even sharper decline to 4.4% for the 12 months ending May 2018. This downward shift continued even as the ECB engaged in QE throughout the period.” – bto: was auch erklären dürfte, weshalb es in Europa schon wieder nachlässt.
- “In China, year-over-year M2 growth was 13.7 % in November 2015, the last month before the current Fed tightening cycle began. In May 2018, the annual growth rate fell sharply to 8.9%, a near record low since 2000. April and May’s historically weak M2 expansion is notable since it appears the PBOC’s reserve requirement cuts failed to reverse the trend.” – bto: Auch in China lahmt die Konjunktur und die Börse gehört zu den schlechtesten in diesem Jahr.
- “Japan’s M2 growth rate has continued tofall as U.S. monetary restraint intensified. In thetwelve months ending in May 2018, M2 increased by just 3.2%. This was nearly a 25% deceleration in growth from October 2017. Looking back, May’s M2 growth is below the entry point of the 2014 recession. It is not surprising, with the sharp deceleration in money, that Japan’s economy contracted in the first quarter of 2018 by 0.6%.” – bto: Es liegt immer an der einfachen Tatsache, dass wir steigende Schulden brauchen, um Wachstum zu erzeugen.
Nun ist die Geldmenge das eine, dass andere ist die Umlaufgeschwindigkeit des Geldes, V:
- “Money velocity (V) is determined by acomplex mathematical function and influencedby secular, short-term and cyclical factors. Secular factors are persistent and will prevail over time. Short-term factors, like massive swings in inventory investment, are quick to fade. Cyclical factors may hold sway around economic turning points, particularly when the economy is shifting from expansion to contraction. The complexity should not be surprising since V = GDP / M2 andGDP = C + I + G + X. Anything that influences consumption, investment, government spending or net exports will have some influence on velocity. Thus, Irving Fisher’s equation of exchange (GDP= M2 x V) is only the starting point in assessing fluctuations in velocity.” – bto: Das ist also erst mal die Theorie.
- “The dominant secular determinant of velocity appears to be the GDP-generating capacity of debt, which is declining in all major economies worldwide. Money and debt are created simultaneously. If the debt produces a sustaining income stream to repay principal and interest, then velocity will rise since GDP will eventually increase beyond the initial borrowing. If advancing debt produces increasingly smaller gains in GDP, then V falls. (…) Consistent with this interpretation, velocity has dramatically fallen since 1998 for all four economies: the U.S., Europe, Japan and China (Chart 5).”
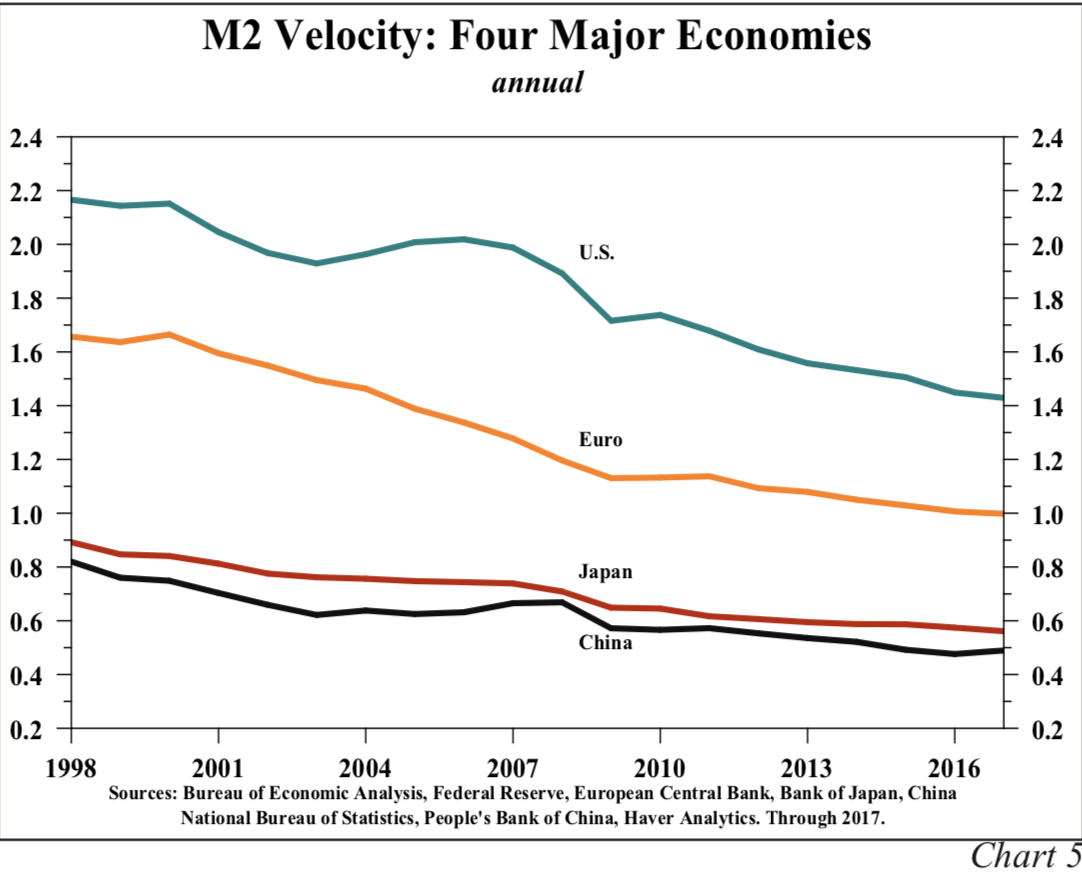
Quelle: Hoisington
- “In the more heavily indebted Japan, China and the euro area, velocity is lower than the less indebted United States. Thus, other than for short non-sustaining episodes, velocity will reinforce, not offset, the decrease in M2 growth evident worldwide.” – bto: was aber auch bedeutet, dass eine Politik, die auf Problemlösung durch mehr Schulden setzt, die Probleme vergrößert.
- “Counting the recessions of the early 1980s as one, there have been 20 contractions since 1900 and M2 growth decelerated prior to 17 of these recessions. With GDP as the ultimate coincident indicator and M2 as the leading indicator then, algebraically,velocity will lag. Consequently, velocity has risen going into the vast majority of all these recessions (Chart 6).”
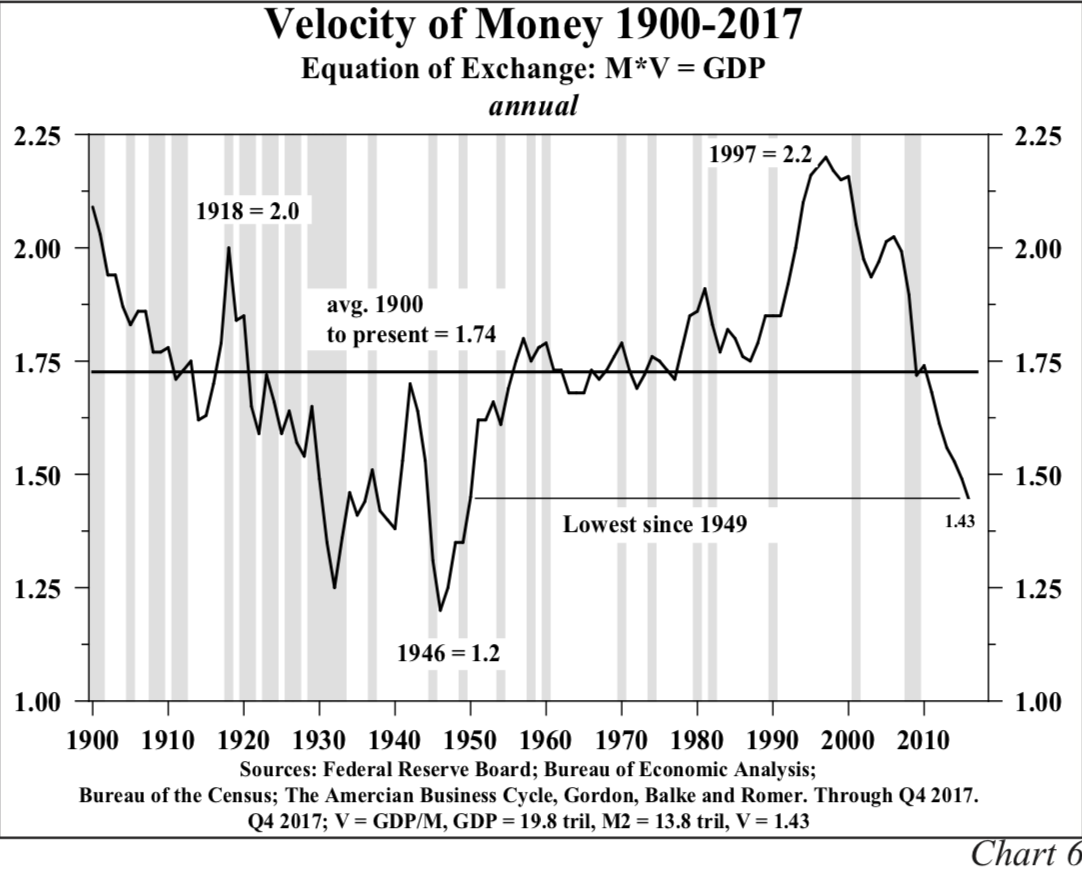
Quelle: Hoisington
- “The slowdown in money growth, combined with secular weakness in velocity, indicates that the global aggregate demand curve over time willshift inward, simultaneously weakening inflation and economic growth. Since inflation is a money- price-wage spiral, the longer-term inflation risks are clearly to the downside. Monetary policy operations will restrain future economic growth (…).” – bto: So ist es, weil sie immer mehr falsche Investitionen ermöglichen.
- Und die Schulden haben immer weniger realwirtschaftlichen Effekt:
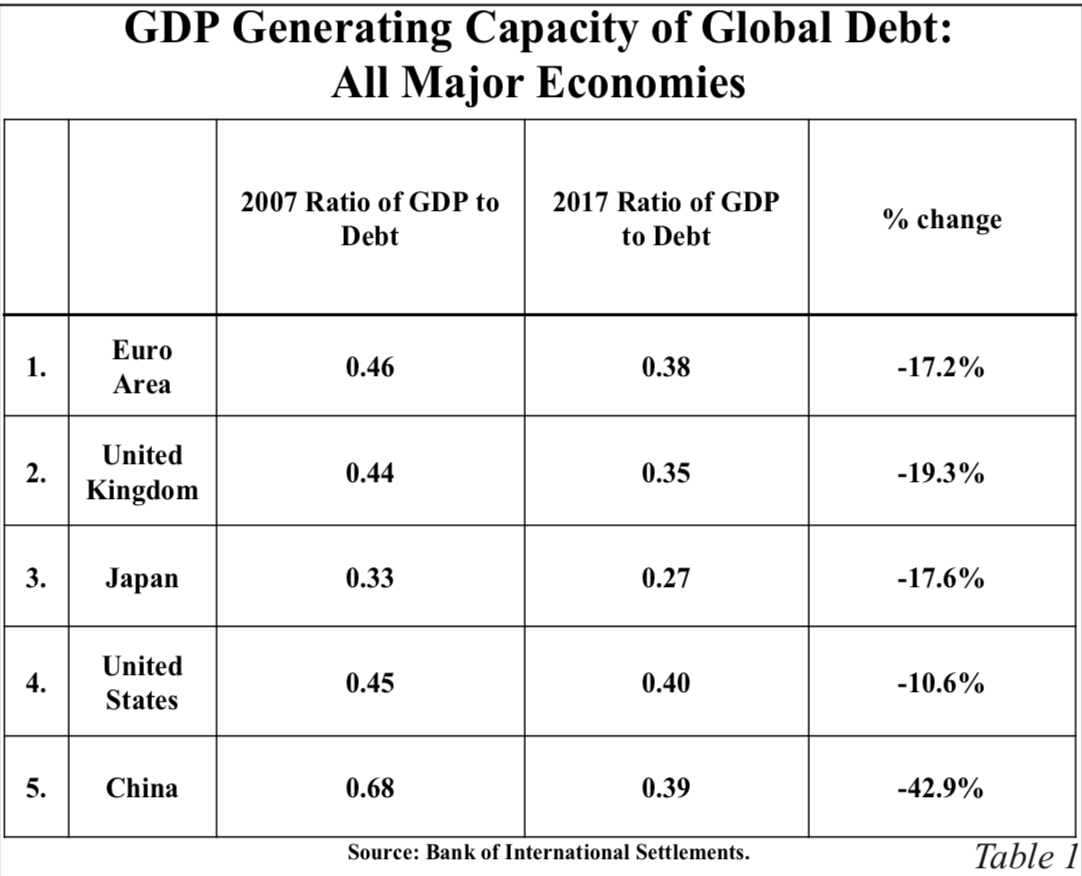
Quelle: Hoisington
Das zeigt – wie ich finde – dass wir uns einem Ende der Wirksamkeit der Geldpolitik nähern. Mit allen damit verbundenen Problemen. Vor allem der Herausforderung, den immer höheren Schuldenberg irgendwie abzutragen. Denn nehmen, wie hier angedeutet, die deflationären Tendenzen – auch durch die Schulden bedingt – weiter zu, ist das in einer überschuldeten Welt der ultimative Crash. Den gilt es, unter allen Umständen zu verhindern.
Global sieht das Bild nicht wirklich besser aus:

Quelle: Hoisington
- “After decades of overuse, debt is increasingly less productive in all of these areas. Ten years ago, the debt overhang was centered in the U.S., the euro area and Japan. Currently, all major economic regions fit this description as China and the emerging markets now separately carry record levels of debt relative to GDP. The Bank for International Settlements (BIS) shows that in 2017, one dollar of nonfinancial debt generated $0.40, $0.38, $0.39, $0.35 and $0.27 of GDP, respectively, in the U.S., the euro area, China, the U.K. and Japan (Tables 1 & 2). All of these data points have significantly worsened over the last decade, the greatest deterioration being that of China which has declined by 43% since 2008. Among all regions, Japan’s debt exhibited the weakest level of debt productivity at $0.27. While one dollar of emerging market debt produced a seemingly enviable $0.52 of GDP in 2017, this ratio was down 38% from 2007.” – bto: was aber auch zeigt, dass es eben noch andere Faktoren gibt, namentlich Demografie.
- Und dann kommen sie mit dem hier immer wieder diskutierten Problem der abnehmenden Produktivität: “(…) business productivity from the late 20th century’s digital revolution has stalled these past two decades due to innovation saturation. Viewed from a longer-term perspective, the differential effect of present inventions is already apparent. In his working paper, “Why Has Economic Growth Slowed When Innovation Appears to Be Accelerating?” (National Bureau of Economic Research, 2018), Gordon calculates that the decline in economic growth in the last decade is a stunning seven times lower than the average growth rate forthe fifty years between 1920 and 1970, in real GDP per capita terms.” – bto: also keine Chance auf ein Wachstumswunder.
- “It is evident that (…) over- indebtedness, the reliance on additional debt to provide growth, poor demographics, technological constraints and potential trade conflicts, will continue to weigh heavily against ebullient growth.” – bto: Besser könnte man die Meinung von bto nicht zusammenfassen.
- Fazit: “(…) the structurally weak U.S. economy does not support current interest rate levels. The excess levels of debt continue to amass and the short-termbeneficial aspects of even higher levels of debt are likely to be increasingly fleeting. Moreover,the growth impediments on the U.S. economy are more serious in many other parts of the world. As Friedman rigorously proved, a noticeable period of monetary deceleration, now synchronized globally, is consistent with lower, not higher, interest rates.” – bto: Denn nur so bekommen wir das System eine Runde weiter.
Soweit → hoisingtonmgt.com: “Quarterly Review”, September 2018
Was aber bedeutet das für heute? Nun, wir werden die Instrumente auf ein noch radikaleres Maß treiben. Das führt uns aber letztlich immer tiefer in den Morast. Ausweg?