Wie groß ist unsere CO2-Schuld wirklich?
Die Klimakonferenz ist zu Ende. Viel wird kritisiert, aber es gibt auch Lob. So freute sich Bundesaußenministerin Annalena Baerbock: „Die Weltgemeinschaft schafft gemeinsame Finanzierungsmechanismen, um gezielt den am stärksten betroffen Menschen bei Klimakatastrophen zu helfen. Damit schlagen wir ein neues Kapitel in der Klimapolitik auf.“
Der geschäftsführende Vorstand von Greenpeace Deutschland, Martin Kaiser, lobte den Beschluss zu Ausgleichszahlungen, mahnte aber an: „Nun müssen die Verursacher der Klimakrise zu ihrer Verantwortung stehen und den neuen Hilfstopf ordentlich befüllen.“
Um was geht es? Nun, um die Forderung der sogenannten G77 – einer Gruppe von mehr als 130 Entwicklungsländern – nach einem Entschädigungsfonds. Der soll jetzt kommen.
Dabei lohnt es sich zu prüfen, wer denn da eigentlich Geld bekommen soll:
- „The Group of 77 (actually 134 states) includes nations with nuclear weapons and space programmes. It includes the gas sheikhdom Qatar, with the world’s top per capita income, as well as Saudi Arabia, Kuwait, and the Emirates, which hosts an indoor ski resort with a chair-lift and five pistes on artificial snow in a desert shopping mall. It includes states that subsidise fossil fuels on a systematic scale. It includes Bolsonaro’s slash-and-burn Brazil.“
- „The G77 includes China, which accounts for 30pc of current CO2 emissions, and is pursuing an aggressive drive for global superpower supremacy, while ridiculing the liberal West in the state-media as insolvent deadbeats.“ – bto: Nun soll China ja auch einzahlen. Ich denke nur, es hilft zu fragen, wer hier eigentlich Geld bekommen soll.
Das gilt auch mit Blick auf den wirklichen Beitrag zur Erderwärmung. Carbon Brief hat Daten veröffentlicht, die zeigen, welchen Anteil welches Land an den bisher kumulierten CO2-Emissionen hat.
Wikipedia: „Carbon Brief is a UK-based website specialising in the science and policy of climate change. It has won awards for investigative journalism and data visualisation.” Kein Hinweis auf Klimaleugner oder Ähnliches. Also schauen wir mal:
- „In total, humans have pumped around 2,500bn tonnes of CO2 (GtCO2) into the atmosphere since 1850, leaving less than 500GtCO2 of remaining carbon budget to stay below 1.5C of warming. This means that, by the end of 2021, the world will collectively have burned through 86% of the carbon budget for a 50-50 probability of staying below 1.5C, or 89% of the budget for a two-thirds likelihood.” – bto: Das ist das Budget-Thema.
- „In this article, Carbon Brief looks at national responsibility for historical CO2 emissions from 1850-2021, updating analysis published in 2019. For the first time, the analysis includes CO2 emissions from land use and forestry, in addition to those from fossil fuels, which significantly alters the top 10.” – bto: Das ist auch entsprechend wichtig.
- „In first place on the rankings, the US has released more than 509GtCO2 since 1850 and is responsible for the largest share of historical emissions, Carbon Brief analysis shows, with some 20% of the global total.” – bto: Was nicht verwundert. Mir geht es aber mehr um den deutschen Anteil.
- „China is a relatively distant second, with 11%, followed by Russia (7%), Brazil (5%) and Indonesia (4%). The latter pair are among the top 10 largest historical emitters, due to CO2 from their land. Meanwhile, large post-colonial European nations, such as Germany and the UK, account for 4% and 3% of the global total, respectively, not including overseas emissions under colonial rule.” – bto: Da wir nun wahrlich kleine Kolonien hatten, darf man denke ich anmerken, dass wir keine historische Schuld haben, aus der sich ableiten lasse, dass wir mit Hilfszahlungen voranschreiten. Noch, dass wir deshalb ökonomischen Selbstmord begehen müssen.
- „These national totals are based on territorial CO2 emissions, reflecting where the emissions take place. In addition, the analysis looks at the impact of consumption-based emissions accounting in order to reflect trade in carbon-intensive goods and services. Such accounts are only available for recent decades, even though trade will have influenced national totals throughout modern history.” – bto: Wo zum Beispiel Deutschland viel für die Welt produziert hat, was unseren Anteil wiederum senkt.
- „The analysis then explores the figures in relation to population, where the likes of China and India fall down the rankings. Notably, per-capita rankings depend strongly on the methodology used and – unlike cumulative emissions, overall – these figures do not relate directly to warming.” – bto: Aber sie spielen sehr wohl eine wichtige Rolle. Denn es ist klar, dass mehr Menschen zu mehr Emissionen führen, weshalb natürlich ein effizienter Umgang mit den Ressourcen entsprechend wichtig ist.
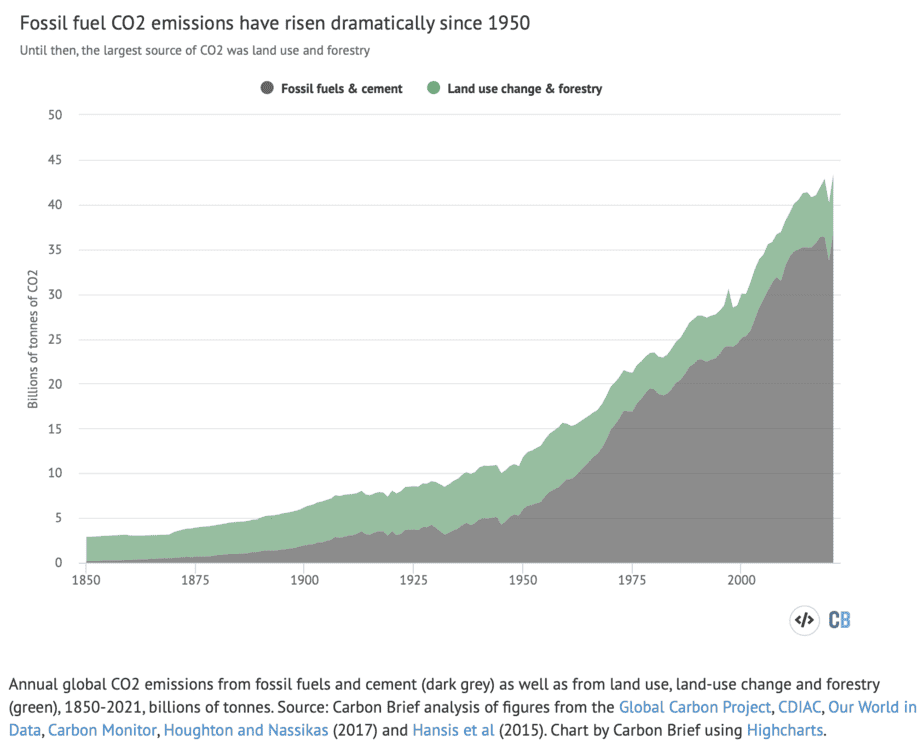
- „The chart below shows how rapidly global CO2 emissions have risen over the past 70 years. It also highlights the split between CO2 emissions from fossil fuels and cement, shown in grey, compared with those from land use, land-use change and forestry (LULUCF, green).“ – bto: Es ist auch wichtig, neben dem Verbrauch fossiler Brennstoffe, Landverbrauch und Abholzung von Wäldern zu betrachten:
 Quelle: Carbon Brief
- „(…) while the large majority of CO2 emissions today are from burning fossil fuels, human activity, such as deforestation, has made a significant contribution to the cumulative total.Land-use change and forestry added some 786GtCO2 during 1850-2021, amounting to nearly a third of cumulative total, with the remaining two-thirds (1,718GtCO2) from fossil fuels and cement. In terms of assigning national responsibility for current warming, it is therefore impossible to ignore the important contribution from CO2 emissions due to land-use change and forestry.” – bto: Das wird gern unterschlagen, vor allem von Aktivisten.
- „The question of who is responsible for using up the carbon budget is clearly crucial in the context of climate justice debates. It speaks to the responsibility for dealing with the impact of climate change to date – as well as who ought to do the most to prevent further warming. However, assigning responsibility is far from straightforward. Carbon Brief’s analysis primarily looks at cumulative national territorial emissions, since this is the way the available data is presented.” – bto: Und da haben wir als Exportland einen höheren Anteil als eigentlich gegeben.
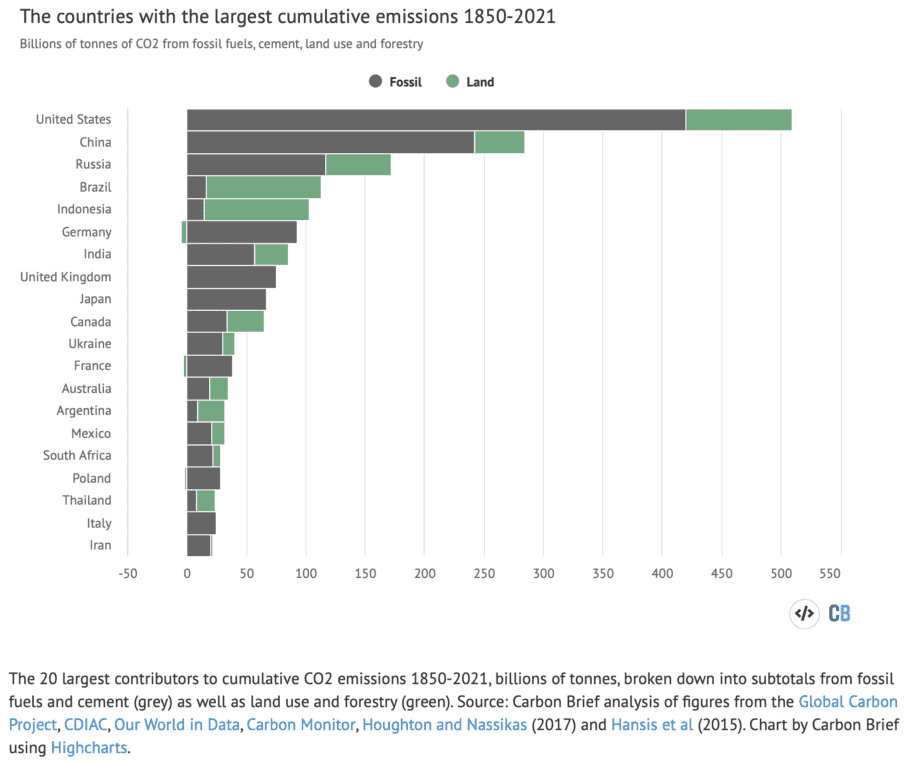
- „In loose terms, cumulative national allocations give ‚responsibility‘ for historical emissions to the modern-day country that occupies the territory that emitted in the past. (…) On this basis (this) shows for the first time the countries most responsible for historical emissions as they accumulate during 1850-2021.” – bto: Das ist interessant:
Quelle: Carbon Brief
Die Darstellung ist nur in gewissem Umfang überraschend. Man sieht, dass auch mit Blick auf die Historie, die USA und China vorn liegen. Russland, Brasilien und Indonesien liegen ebenfalls vor Deutschland, was durchaus bemerkenswert ist. Wir sehen auch, dass wir beim Thema Wälder einen Beitrag zur Reduktion von Emissionen geleistet haben: „Germany, in sixth place with 3.5% of cumulative emissions thanks to its coal-reliant energy industry, illustrates how some countries’ land sectors have become cumulative CO2 sinks rather than sources, as trees have returned to previously deforested areas.“ – Wir könnten viel besser dastehen, wenn wir Kernkraft statt Kohle verwenden würden.
Doch diese Darstellung ist noch nicht genug. Denn sie berücksichtigt nicht, wie viele Menschen in Deutschland und in den anderen Ländern in dem Zeitraum gelebt haben. Hier wird es dann richtig interessant:
- „One way to attempt to untangle this is to normalise countries’ contributions to cumulative CO2 emissions according to their relative populations. Unlike cumulative historical emissions, which relate directly to current warming, these per-capita figures are not immediately relevant to the climate (…) While cumulative per-capita emissions are interesting, they shouldn’t be interpreted as country shares of responsibility because they’re not directly relevant to the climate. (…)” – bto: Es ist so: Es kommt auf das absolute Niveau an, richtig. Aber wenn es um „Schuldfragen“ und Entschädigungen geht, muss man zwingend auch auf diesen Aspekt schauen.
- „Another way to think about this is to note that small countries with high per-capita emissions are still relatively unimportant for warming overall. For this reason, the table below excludes countries with present-day populations lower than 1 million people. (This removes the likes of Luxembourg, Guyana, Belize and Brunei.)” – bto: Das finde ich richtig, es bleibt aber ein wichtiger Datenpunkt, den man nicht wegwischen darf.
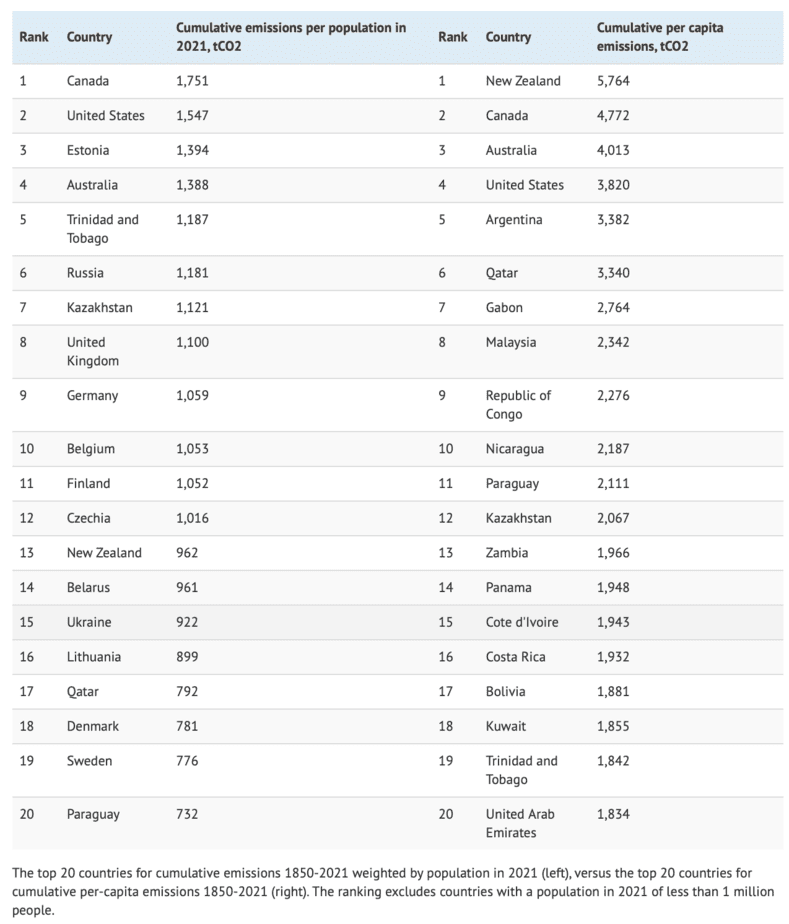
- „Carbon Brief’s analysis for this article approaches the question of accounting for relative population sizes in two different ways. These approaches give markedly different results, highlighting the challenge of interpreting cumulative per-capita emissions. The first approach takes a country’s cumulative emissions in each year and divides it by the number of people living in the country at the time, implicitly assigning responsibility for the past to those alive today. The table, below left, shows the top 20 countries on this basis, as of 2021. The second approach takes a country’s per-capita emissions in each year and adds them up over time, with the result, as of 2021, shown in the table, below right. This gives equal weight to the per-capita emissions of the populations of the past and of the present day.” – bto: Was ich so verstehe, dass im zweiten Rechenweg die Einsparungsleistung der aktuellen Generation mehr zur Geltung kommt.
Quelle: Carbon Brief
- „Perhaps the most notable impact of accounting for population is the absence, in the table above, of several of the top 10 for cumulative emissions overall, namely China, India, Brazil and Indonesia. While these countries have made large contributions to global cumulative emissions, they also have big populations, making their impact per person much smaller. Indeed, those four countries account for 42% of the world’s population, but just 23% of cumulative emissions 1850-2021. In contrast, the remainder of the top 10, namely US, Russia, Germany, the UK, Japan and Canada, account for 10% of the world’s population, but 39% of cumulative emissions.” – bto: Das begründet natürlich, weshalb diese Länder einen höheren Anteil an den Folgekosten tragen sollten (insofern man dem gesamten Konzept überhaupt folgt).
- „Estonia, for example, has long relied on oil sands for most of its energy needs, meaning it has had high annual per-capita emissions. The Estonian government has pledged to phase out oil sands production by 2040.” – bto: Das wusste ich auch nicht und es hätte natürlich zu Fragen geführt.
- „New Zealand ranks at the top of this list because of extensive deforestation during the 19th century, when much of its native Kauri forest was cleared for its valuable timber. The country’s tiny population at the time consequently had very high annual per-capita emissions, with the cumulative total by 1900 making up around two-thirds of the total amassed by the present day.” – bto: Auch das leuchtet ein.
Was bedeutet das nun für die Diskussion um Entschädigungen?
- In den letzten zehn Jahren hat westliche Technologie die Kosten für neue Sonnen- und Windenergie massiv gesenkt, wovon die ganze Welt profitiert. (Allein wir Deutschen für Solarenergie ca. 80 Milliarden Euro)
- Währenddessen haben einige G77-Staaten neue Kohlekraftwerke gebaut, weil China subventionierte Exportkredite gewährt.
- Wie ordnen wir in solchen Fällen die moralische Haftung zu?