US-Börse: von wegen keine Blase!
Das nenne ich Optimismus:
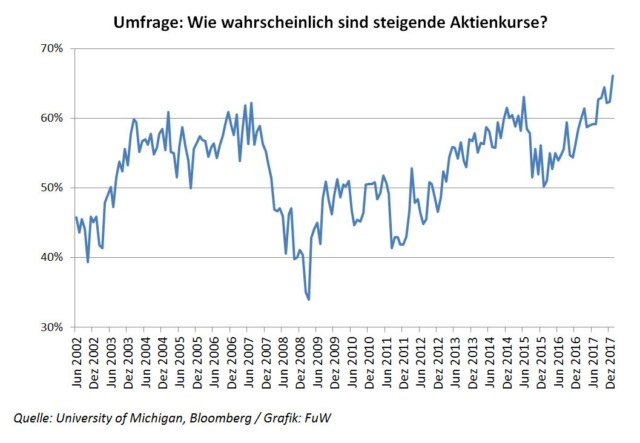
Quelle: FINANZ und WIRTSCHAFT
Ja, es kann noch lange weiter bergan gehen. Ja, ich liege seit langem mit meiner Skepsis falsch. So be it. Hier ein erneuter Beweis der Party:
- “Currently, seven of the eight traditional valuation techniques shown by Goldman Sachs below are in the upper strata of recent history.” – bto: wobei man natürlich sagen muss, wenn der Free Cash Flow Yield noch passt, kann es wirklich noch weitergehen.
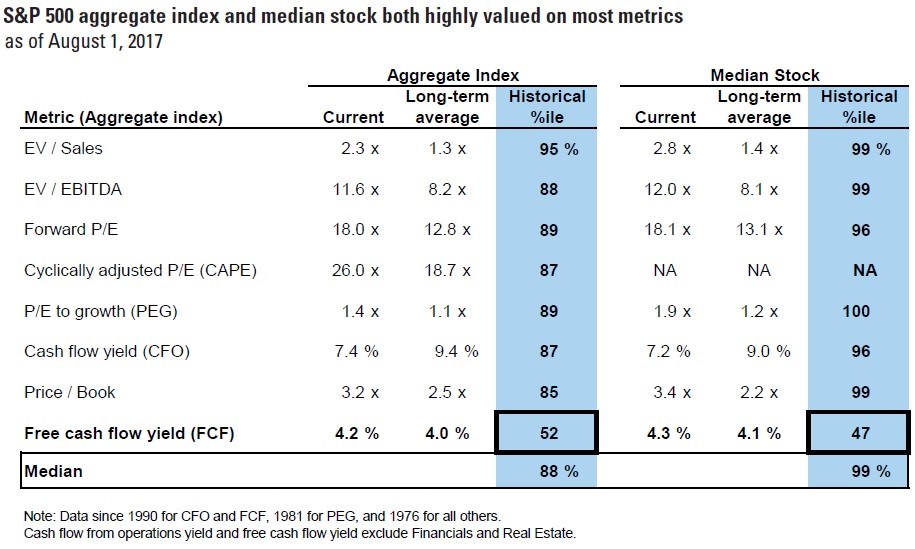
Quelle: Goldman Sachs, Real Investment Advice
- “(…) it is equally important to normalize different periods of time to make their valuations comparable based on the level of economic growth which directly supports corporate profits. The result of our analysis shows that the current level of Cyclically Adjusted Price to Earnings (CAPE) is well above the levels of every other market peak, including 1999 and 1929. Essentially, investors are willing to pay more for each unit of economic growth today than at any time in modern history.” – bto: was man eben NICHT mit den tiefen Zinsen erklären kann.
- “While the economy cycles from recession to growth and back, the long term economic growth trend, or secular GDP, has trended lower for the better part of the last 30 years. There are a number of reasons (…): Debt, Demographics, Productivity (…).” – bto: bekannt.
- “Given our assumption that long-term economic trends are likely to persist, we believe it is necessary to use economic growth to normalize current equity valuations to compare them to prior periods. The following graph (…) plots CAPE divided by the trailing ten-year growth rate of nominal GDP.” – bto: Da das Wachstum schwächer wird, ist klar, dass wir es mit einer sehr hohen Bewertung zu tun haben!
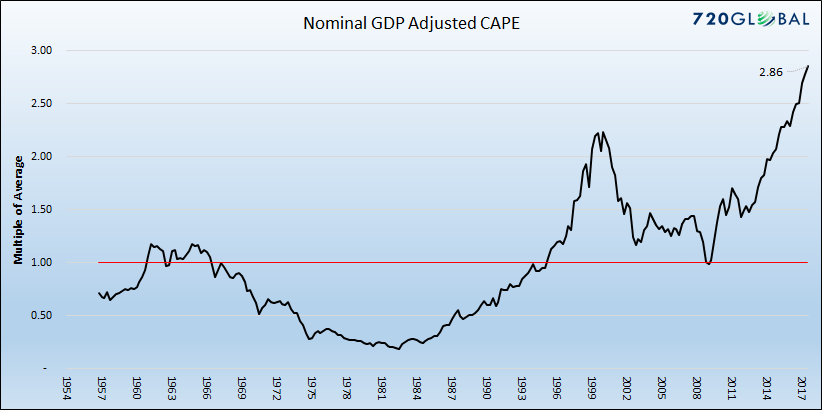
Quelle: St. Louis Federal Reserve (FRED), Robert Shiller, Real Investment Advice
“Note that the graph above and all of the graphs normalizing CAPE in this article, are scaled by multiples of the average on the y-axis instead of the calculated number. The rationale being that the purpose of the analysis is not to provide a concrete numerical data point, but a comparative measure that allows one to relate valuations over many different economic environments. As an example the current reading is 2.86, meaning market valuations using this measure are 2.86 times higher than the average since 1956.” – bto: Das ist schon beeindruckend!
- “For those that think economic growth will be better than the trend of the last thirty years, you should be aware that a ten-year growth rate of 8.21% is required to bring the adjusted valuation to its long-term mean. Such a ten-year growth rate has not been witnessed since 1987 and is nearly 2% greater than the average over the last 70 years.” – bto: einleuchtend und deshalb nicht erfreulich.
- “Corporate profit margins, or the difference between sales and net profits, are considered one of the most cyclical fundamental measures that exist. The reason is that, when margins are high in certain industries, new entrants are lured to those industries by the higher margins. Conversely, when margins are low, companies exit those industries and those remaining companies can increase margins. The graph below shows the cyclical nature of corporate margins since 1948.” – bto: o. k., nicht auf Rekord, aber doch sehr hoch.
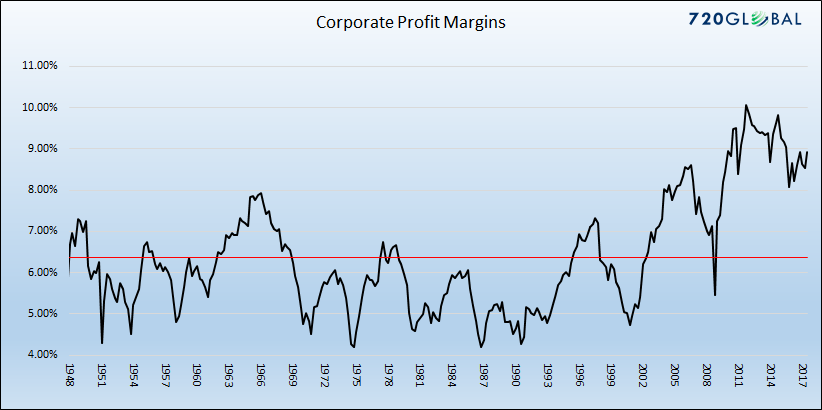
Quelle: St. Louis Federal Reserve (FRED), Real Investment Advice
- “When margins are higher or lower than average, it makes sense to assume they will revert to the mean over time. Therefore, the rationale and logic for normalizing CAPE based on current margins and its historical tendency, provides a valuation level, as shown below, that is comparable to other periods.” – bto: wobei man auch argumentieren kann, dass wir es mit stabilen Oligopolen und Killer-Geschäften zu tun haben, die dauerhaft mehr Marge verdienen. Siehe meine Kommentare dazu bei WirtschaftsWoche Online.
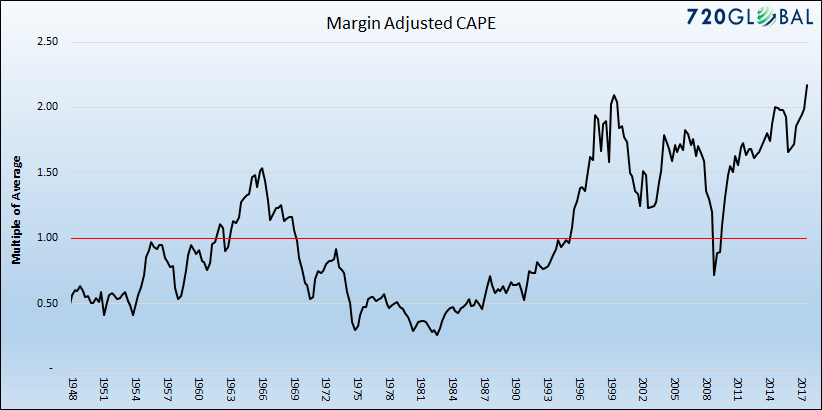
Quelle: St. Louis Federal Reserve (FRED), Robert Shiller, Real Investment Advice
- “We believe that durable longer-term economic trends and profit margins should be used to normalize CAPE and again make it comparable to prior periods. The graph below presents CAPE adjusted for both.”
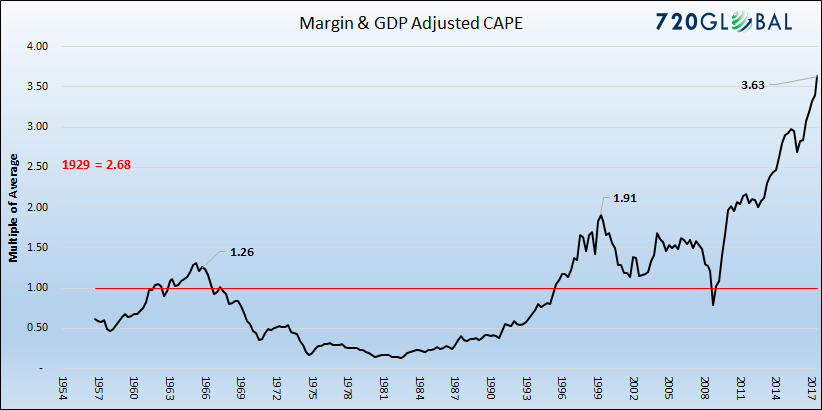
Quelle: St. Louis Federal Reserve (FRED), Robert Shiller, Real Investment Advice
- “The graph above highlights that valuations using this measure dwarf any prior valuation peak since at least the 1950’s. At over 350% above the mean, stock investors are currently paying significantly more for a unit of economic growth than at any time in the last 70 years. To extend the analysis, we estimated the adjusted CAPE level of 1929, as shown on the graph, and come to the same conclusion.” – bto: Dennoch kann es bekanntlich noch lange weitergehen. Kann. Muss nicht.
- “Most astute investors know that stock valuations are at or near historical highs. Even these investors, however, may be unaware that today’s valuations, when adjusted for the level of economic growth and heightened profit margins, defy comparison with any prior period since the Great Depression. The simple fact is that investors are paying over three times the average and almost twice as much as the prior peak for a dollar of economic growth. Furthermore, it is happening at a time when we are clearly late in the economic cycle and the outlook for growth, even if one is optimistic, is well below that required to justify such a level.“
Es wird in diesem Jahr definitiv eine Anpassung geben. Ob sanft oder deutlich werden wir sehen.
→ Real Investment Advice: “A Market Valuation That Defies Comparison”, 24. Januar 2018
Absoluter Wahnsinn! Da 13 von 14 Punkten, die Smith bereits 2013 prognostiziert hat, eingetreten sind, sollte man sein Fazit ernst nehmen (und entsprechend handeln).
Es reizt mich schon eine Weile dieses 5 Jahre alte Zitat hier zur Diskussion zu stellen:
->Im Ergebnis verharrt die Gesamtverschuldung auf einem hohen Niveau, während die
Gehälter und die Realwirtschaft stagnieren. Das Kreditwachstum sinkt gemeinsam mit der
Geldumlaufgeschwindigkeit, da die von den Zentralbanken bereitgestellten Kredite (und die
Gewinne aus den jüngsten zentralbankfinanzierten Finanzblasen) in den Investmentbanken,
Hedge Fonds und Unternehmen geparkt werden und sich dort anhäufen.
Unterm Strich haben wir dann eine überschuldete Wirtschaft mit Überkapazitäten, die nicht in
der Lage ist, reales Wachstum hervorzubringen. Sie kann nur noch spekulative Finanzblasen
hervorbringen, die implodieren und die jüngste Runde an Phantom-Kreditsicherheiten
vernichten. <- http://www.oftwominds.com/blogfeb13/global-game2-13.html
Wir sind heute in der zweithöchsten Überbewertung der gesamten Börsengeschichte.
Nur 2000 gab es noch höhere Bewertungsniveaus.
Insofern ist heute kein guter Zeitpunkt, ein langfristiges Neuinvestment am Aktienmarkt zu beginnen.
Aufgrund langjährig stagnierender Realeinkommen und Verschiebung der wirtschaftlichen Kraftzentren der Welt in Richtung Asien ist die aktuelle Hausse auch eher freudlos bzw. durch die extreme Niedrigzinspolitik der Notenbanken erzwungen.
Dies ganz im Gegensatz zum New – Economy – Boom, wer sich noch erinnert.
Hingegen wirkt Überoptimimus wie jener von Burkhard Varnholt in 2015 heute eher seltsam deplaziert:
https://www.handelszeitung.ch/invest/baer-anlagechef-boersen-duerften-sich-verdoppeln-781322
https://www.bilanz.ch/people/burkhard-varnholt-fehlerhaftes-orakel-416433
Das ist falsch. Langfristig lohnt immer.
Gerade bei den Emerging Markets machen sie da langfristig nichts falsch.
Einfach einen monatlichen Sparplan in derartige ETFs über 20 Jahre machen und sie werden staunen.
Das stimmt so nicht.
Bedenken Sie, wo Rußland vor 10 Jahren stand (1 Euro = 35 Rubel) und heute (1 Euro = 70 Rubel).
https://www.boerse.de/devisen/Euro-Rubel/EU0001458346
Die Währung hat sich in 10 Jahren halbiert und der nationale Aktienindex liegt weit unter dem Allzeithöchststand von 2008.
https://www.boerse.de/indizes/RTS/RU000A0JPEB3
Vergleichbar Brasilien:
2008 1 Euro = 2,5 Real und heute 1 Euro = 4 Real
https://www.boerse.de/devisen/Euro-Real/EU0006169823
https://www.boerse.de/indizes/iBovespa/BRIBOVINDM18
https://www.boerse.de/etf/LYXOR-ETF-BRAZIL-IBOVESPA/FR0010408799
Auch hier kann man mit der 200 – Tage – Linie arbeiten…
Das sehen Sie auch gut, wenn Sie sich ETF´s auf die jeweiligen nationalen Aktienindizes in Hartwährung ansehen (EUR, USD).
Glücklich sind Momente, in denen Börsen und Währungen abstürzen, weil üblicherweise eine starke Gegenbewegung auftritt.
Wie zuletzt 2015 und 2016.