Treibt die Liquidität die Märkte weiter?
Die spannende Frage für die Märkte dieses Jahr: Genügt es, dass die Notenbanken auf dem Gaspedal bleiben, um die Börsen oben zu halten oder gar weiter zu treiben? Ich fand zwei Kommentare dazu interessant: Michael Hartnett von der Bank of America (via Zero Hedge) und John Authers von Bloomberg:
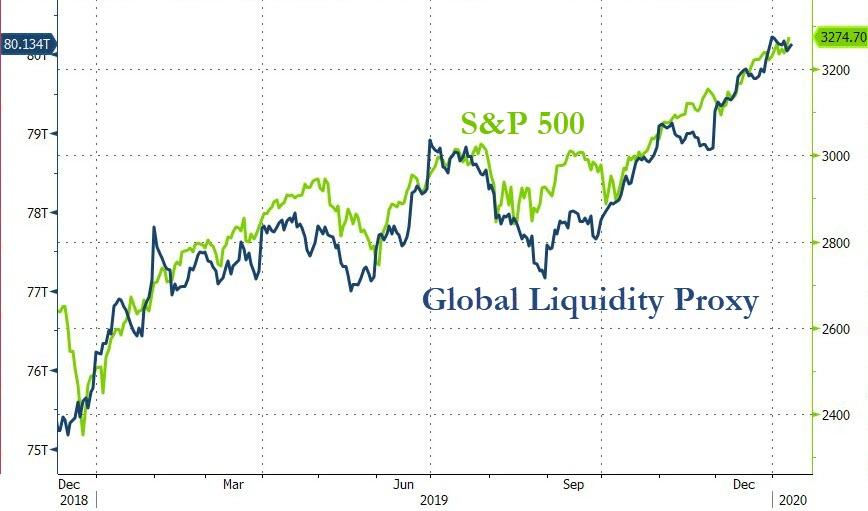
- “(…) Michael Hartnett, remains stoically bullish on the market, at least until March 3, when he sees the S&P hitting the nice, odd number of 3,333: as he defines the current period, it is one of ‘maximum liquidity, minimal growth’, as a result of a firehose of QE liquidity from the ECB, BOJ and the Fed (yes, the Fed is engaging in QE) with ‘QE annualizing a stunning $1.1 trillion in the past 4 months’ even as global central banks have cut rates 80 times past 12 months, in the process ‘reducing concerns of recession, default, inflation in 2020.’ One look at the chart below of the correlation between the global liquidity proxy and the S&P500 explains why all the market’s fears have been drowned, so to speak, in the past year.” – bto: Ja, Korrelation ist nicht Kausalität. Dennoch ist das Chart interessant!
Quelle: BofA, Zero Hedge
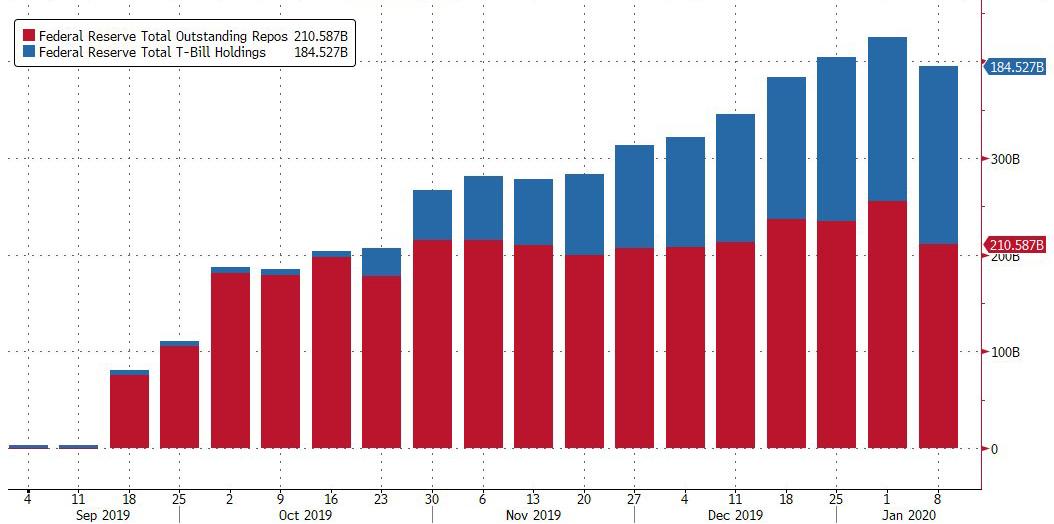
- “However, the BofA strategist is far less sanguine about what happens after March, when the Fed is expected to start draining its repo liquidity (…).” – bto: Das ist die Frage. Bisher hat die Fed hinter Einbrüchen an Märkten und Konjunktur gestanden, wenn sie vom Gaspedal ging. Die Frage ist nur, macht sie es dennoch bzw. wenn sie es nie mehr macht, was wäre die Folge? Ewig steigende Märkte ja wohl nicht.
Quelle: BofA, Zero Hedge
“Hartnett outlines the more interesting bull and bear arguments for risk assets in 2020.
Bulls say …
- “There’s always a bubble in the ’20s: South Sea Company bubble in 1720s, UK mining stock bubble in 1820s, Dow Jones bubble in 1920s; big overshoot of asset prices (SPX 4,444) possible so long as Fed fixes rates at low & stable levels.” – bto: Ich halte recht wenig von solchen Zahlenspielereien, wobei sie nett sind.
- “There’s no inflation: Japanese wage growth YoY in December was negative in both nominal and real terms; this in an economy in which the population declined by 512k last year, the unemployment rate fell to its lowest rate in 30 years, and the assets owned by the central bank ($5.3tn) now larger than Japan GDP ($5.2tn); no inflation in Japan, Europe, US means no rate rises and cheap financing for populist politicians.” – bto: Richtig und im Notfall finanziert die EZB direkt. Alles. Zum Beispiel den Kauf des Regenwaldes (wie ich soeben auf Twitter gelesen habe. Sollte das weniger tun!). Ob die Verkäufer so bereitwillig Zahlen auf dem Bildschirm akzeptieren, wenn sie so einfach geschaffen werden?
- “There’s lots of liquidity: central banks net purchases were $92bn in Q3, $326bn in Q4 and are forecast to total $447bn in the next 6 months; global central banks cut rates 80 times in past 12 months, 789 times since Lehman (that’s 1 rate cut every 3½ trading days).” – bto: Lasst uns drucken! Realwirtschaft ist egal, Hauptsache die Börsen gehen hoch.
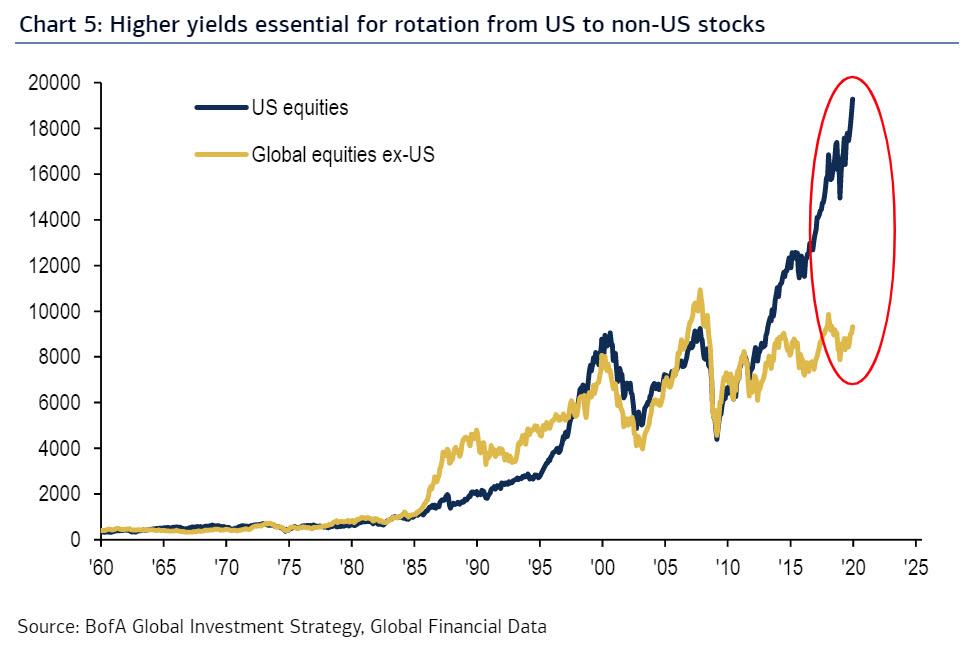
- “There’s the Great Rotation: for all the bubbly stock market talk, global equities have only just exceeded their 2007 highs versus global bonds, and remain below their 2000 highs versus global bonds; and higher yields can cause Great Rotation from bonds to stocks, credit to commodities, US to non-US, large to small, growth to value, tech to banks and so on.” – bto: weshalb viele sagen, man sollte jetzt vor allem auf Europa setzen, weil billig. Auch ich habe das schon mal geschrieben.
Quelle: BofA, Zero Hedge
Nun zu den Bären:
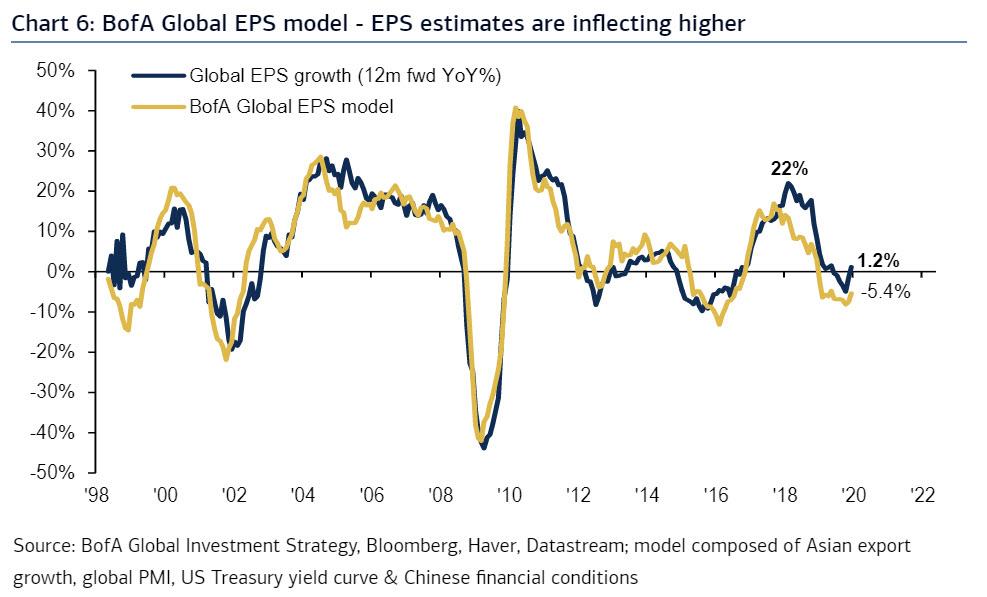
- “There’s an inflection point in profits: BofA Global EPS Growth Model (function of global PMIs, Asian exports, Chinese financial conditions, and UST 2s10s yield curve) forecasts EPS growth of -5.4% in the next 12 months, below consensus of 1.2%; crucially for bulls both forecasts for 2020 EPS are inflecting higher.” – bto: Vielleicht spielen ja die Gewinne doch noch eine Rolle. Und dann würde diese Auseinanderentwicklung ein erhebliches Warnsignal darstellen.
Quelle: BofA, Zero Hedge
- “Impotence rising: equities are at highs & spreads at lows, but volatility in fixed income (MOVE Index) and equities (VIX Index) has crept higher in recent quarters despite renewed QE; higher risk prices and higher volatility a precursor to end of bull market.” – bto: Ich kann das nicht beurteilen, aber Michael Hartnett hat langjährige Erfahrung und einen sehr guten Ruf.
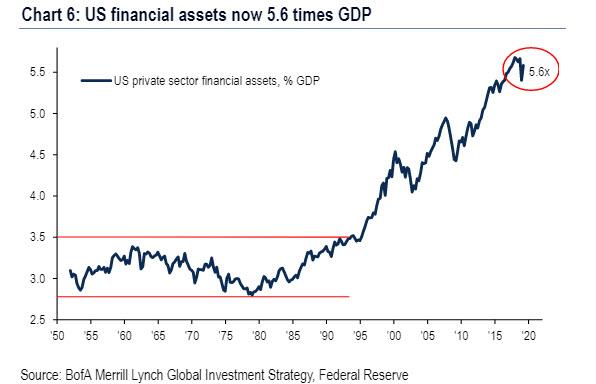
- “Inequality rising: S&P500 ended 2010s in longest bull market of all-time, & just 7% away from becoming the largest (3498); the absolute gains in stocks and bonds mean that the value of US financial assets (Wall St) grew to over 5.5x the size of US GDP (Main St) by 2019E, another all-time high; further Wall St gains, particularly via stock buybacks, increasingly politically unacceptable (note past 5 years 20 S&P500 companies spent $975bn on stock buybacks, that’s $381,000 for every person they employ).” – bto: 381.000 pro Mitarbeiter für Rückkäufe? Wenn das kein Wahnsinn ist, was dann?
Quelle: BofA, Zero Hedge
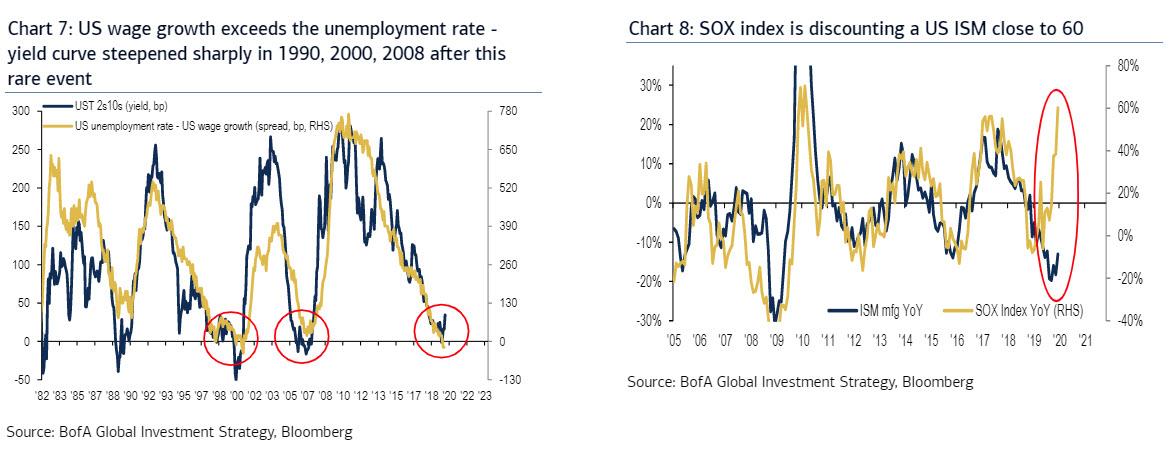
- “Inflation rising: US wage growth exceeds unemployment rate for first time since 2000, has historically coincided with big steepening of the US yield curve either because of inflation, defaults, or recession (Chart 7); note in 2019 US budget deficit surpassed $1tn and US federal government spent $4.4tn, that’s $35,500 for every income tax payer.” – bto: Das wiederum glaube ich nicht. Die letzten Daten deuten auch auf einen Rückgang der Lohnsteigerung hin. Ich denke, die Inflation bekommen wir erst, wenn die Helikopter nicht nur kreisen, sondern auch abwerfen.
- “2020 recovery “priced-in”: semiconductor prices are “pricing-in” US ISM of 60, the highest since the financial crisis (vs. 47.2 today – Chart 8); Global FMS profit expectations (Nov/Dec = biggest 2-month jump since May’09) ‘pricing-in’ global PMIs of 55 next 6-months; Global FMS 2020 ISM expectations was 53.5 in Dec.” – bto: Doch wo soll der Aufschwung herkommen? Klar, das billige Geld kann wirken. Aber ob es das tut?
Quelle: BofA, Zero Hedge
Nett balanciert – das Pro und Contra. Ich lese es dennoch als eindeutiges Warnsignal. Doch kommen wir zur John Authers:
- “(…) Hyman Minsky (…) argued that the economic cycle is driven more by surges in the banking system and in the supply of credit than by the relationship which is traditionally thought more important, (…) Robert Barbera’s explanation of Minsky’s ideas, this dynamic is explained well here: The last five major global cyclical events were the early 1990s recession — largely occasioned by the U.S. Savings & Loan crisis, the collapse of Japan Inc. after the stock market crash of 1990, the Asian crisis of the mid-1990s, the fabulous technology boom/bust cycle at the turn of the millennium and the unprecedented rise and then collapse for U.S. residential real estate in 2007-2008. All five episodes delivered recessions, either global or regional. In no case was there as significant prior acceleration of wages and general prices. In each case, an investment boom and an associated asset market ran to improbably heights and then collapsed. From 1945 to 1985 there was no recession caused by the instability of investment prompted by financial speculation — and since 1985 there has been no recession that has not been caused by these factors.” – bto: Und genauso argumentiert auch die Bank für Internationalen Zahlungsausgleich regelmäßig. Das ist das, was ich am Freitag als “Wickselian”-Theorie diskutiert habe. Und da bin ganz eindeutig Wickselianer.
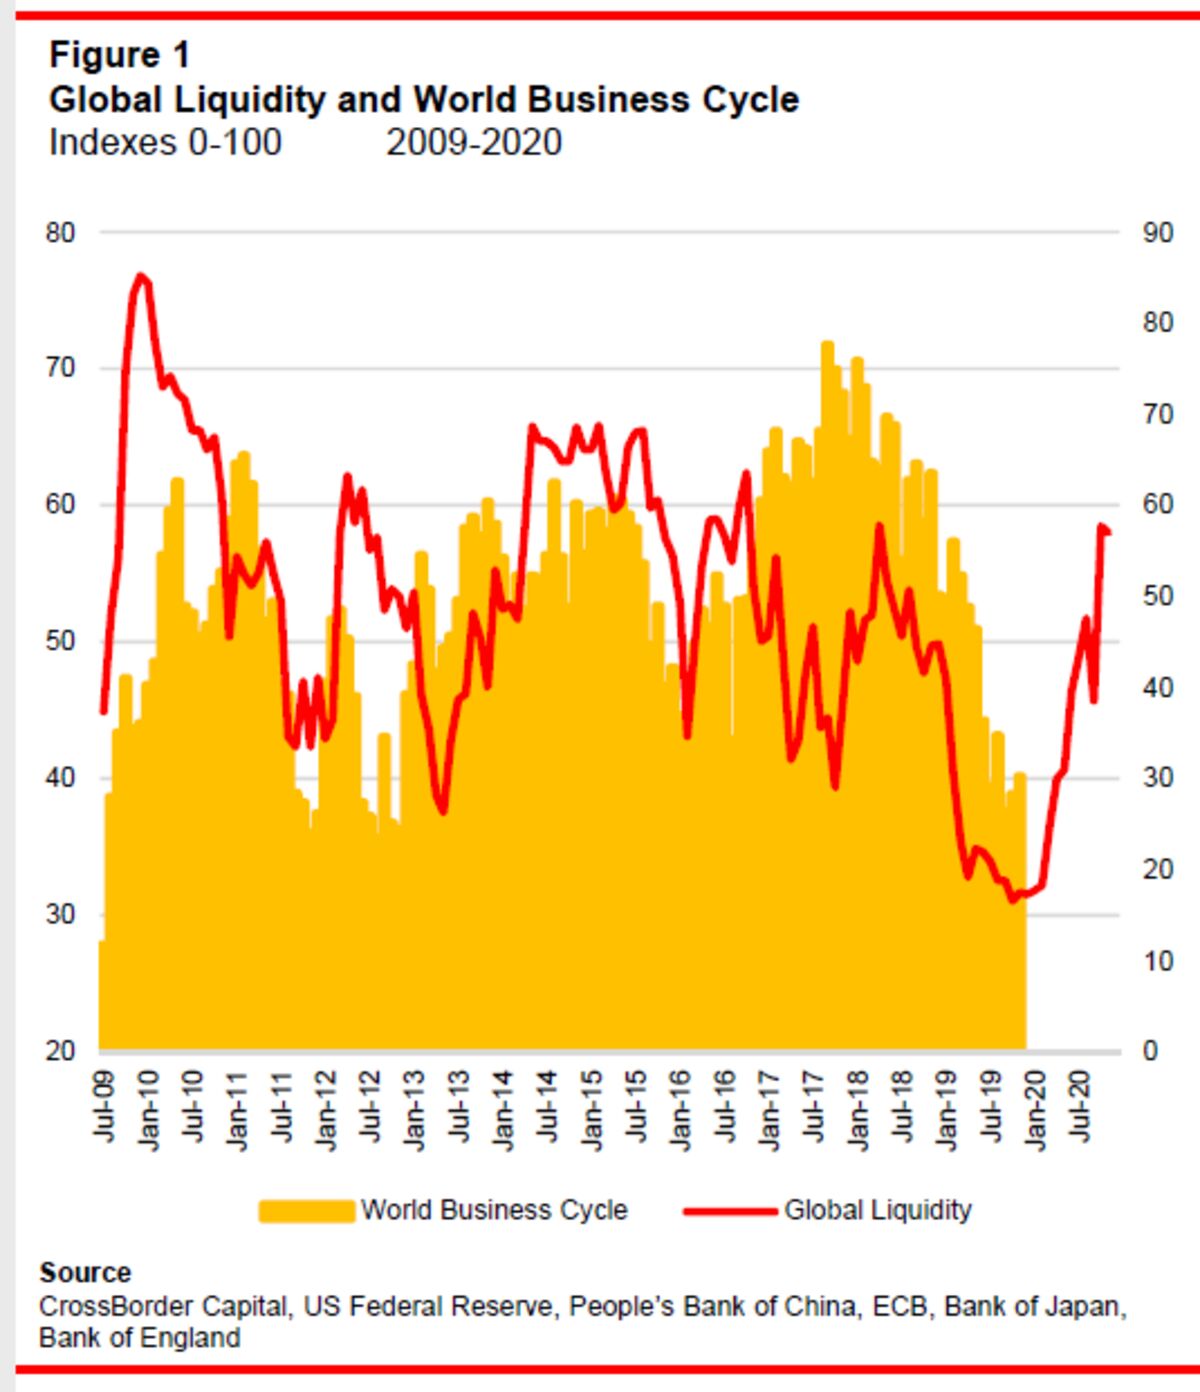
- “So, it may be more important to look at flows of money through the banking system and money markets than to check up on average hourly earnings and the unemployment rate. And they suggest a startling scenario. The following charts all come from London’s CrossBorder Capital, which monitors global liquidity. By its measure, global liquidity has just surged upwards over the last few months. All else being equal, we can expect business activity to follow. The bad news in terms of the Minsky cycle is that we have the conditions for speculation to run riot — but the good news is that we are still early in the cycle.” – bto: Melt-up-Boom, wir kommen! Das klingt doch schon mal gut aus der Sicht jener, die in den Märkten unterwegs sind. Lets dance!
Quelle: Bloomberg
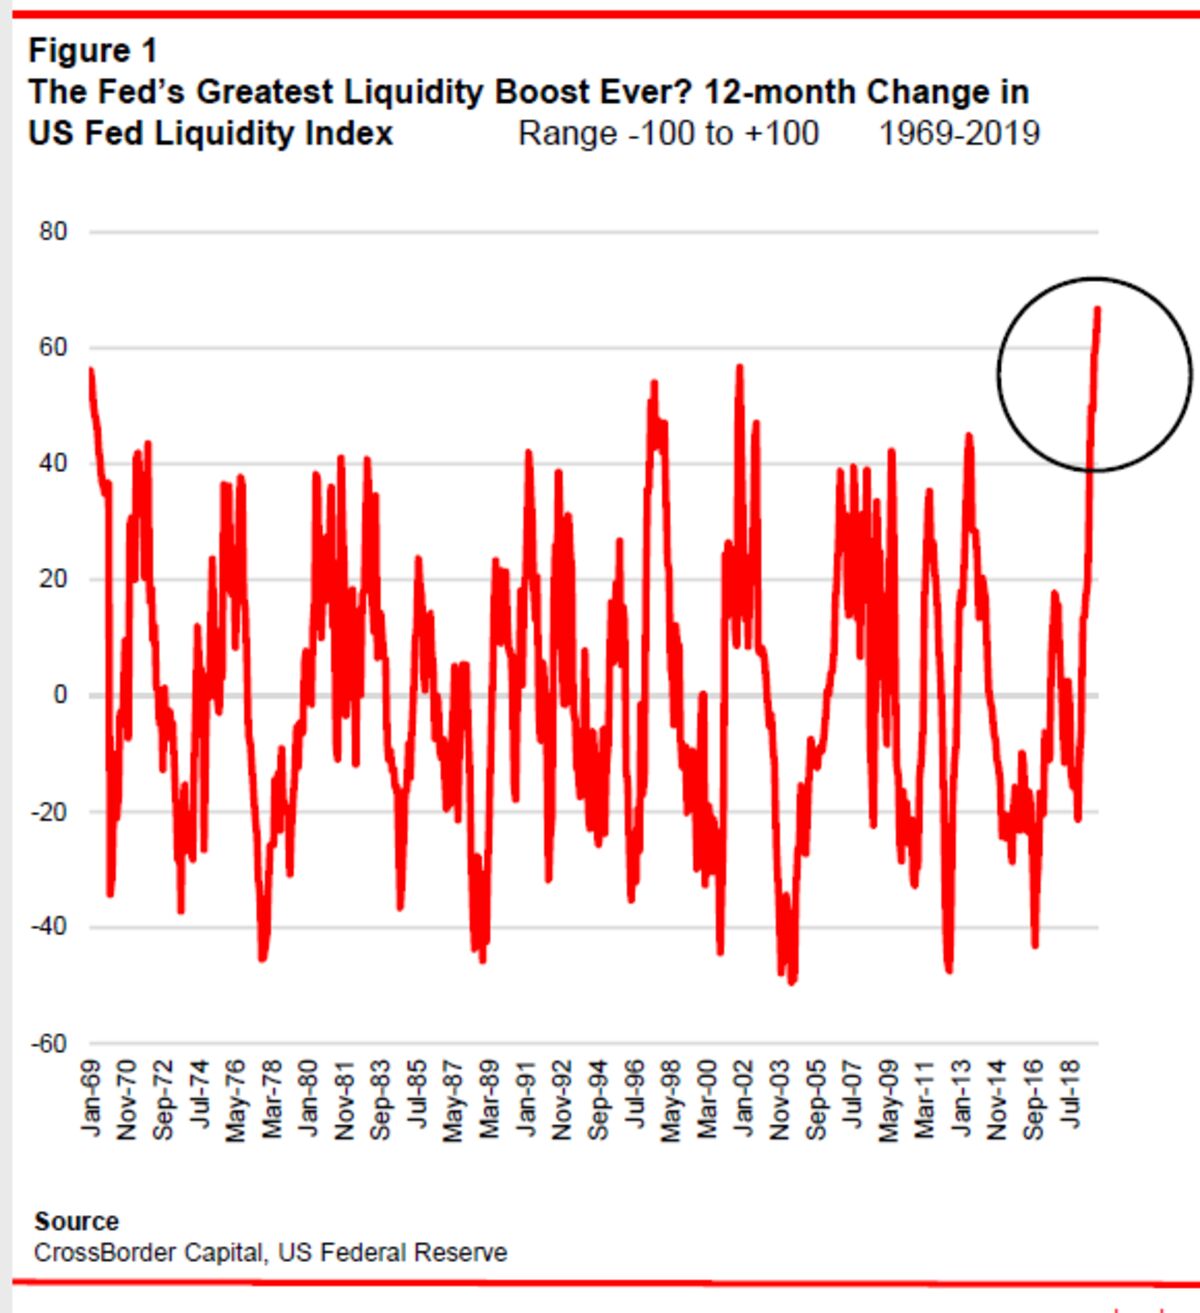
- “As ever, we can thank central banks and particularly the Federal Reserve. Twelve months ago, the U.S. central bank intended to restrict liquidity steadily by shrinking the assets on its balance sheet on ‘auto-pilot.’ That changed, though. It reversed course and then cut rates three times. And most importantly, it started to build its balance sheet again in an attempt to shore up the repo market — which banks use to access short-term finance — when it suddenly froze up in September. In terms of the increase in U.S. liquidity over 12 months, by CrossBorder’s measures, this was the biggest liquidity boost ever:” – bto: und das, ohne dass es zu einer für Laien erkenntlichen Krise gekommen wäre. Spannend. Ich hatte den Repo-Markt ja bereits mehrfach. Es zeigt aber, es ist etwas faul und die Reaktion der Notenbanken macht es noch fauler.
Quelle: Bloomberg
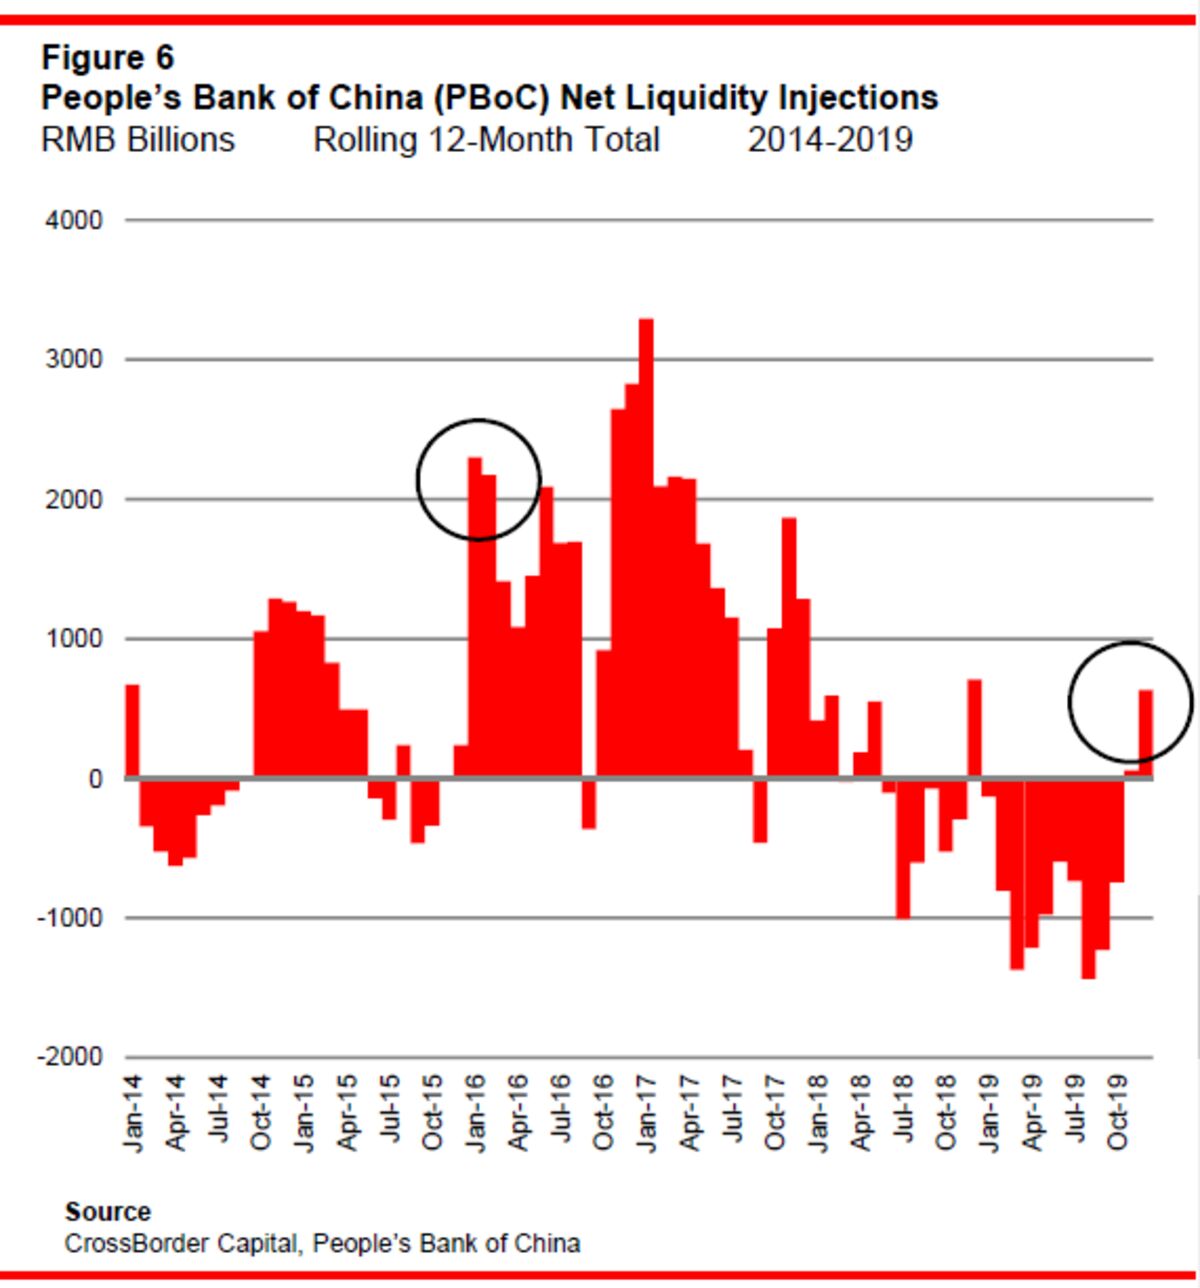
- “Other central banks matter as well. Last year, the People’s Bank of China tightened liquidity as it attempted to clean balance sheets in over-extended local governments. Tightening up also helped to make life difficult for its trading partners as its trade conflict with the U.S. intensified. Now that there is a truce in the trade conflict, will it be able to loosen liquidity again? The signs are that this could happen. After dramatic withdrawals of liquidity, the PBoC has now returned to injections, while also reducing the reserve ratio that banks must maintain, effectively allowing them to lend more. It certainly looks as though they are leaving their defensive crouch. If so, the chances are that we will see yet more liquidity gushing through the world economy.” – bto: Liquidität, wohin man schaut. Und was sollte man damit machen in einer Welt mit Überkapazitäten und Überschuldung?
- “The Minsky schema shows that there are dangers in this. Even 1987, the year of the Black Monday stock market crash, could be a parallel, as it also followed the resolution of difficult trade and currency conflicts — in that case centered on Japan rather than China — that allowed for a surge of liquidity. Movements in the bond market could be crucial. A rise in longer term yields could spoil the party much as they did two years ago, when a sharp rise in stock prices ended as bonds appeared to move into a bear market.” – bto: Doch warum sollten die Anleihen fallen? Ohne Inflation und ohne eine Kursänderung der Notenbanken? Wo es doch eine Flut an Artikeln gibt, die suggerieren, Negativzinsen seien “normal”.
- “If bond yields stay low, presumably thanks to weakness in the economy, then in the long term, as in a few years, this could be a dangerous situation that sets up stock markets for a crash. In the shorter term (which significantly does include the U.S. presidential election), the liquidity administered by the Fed should keep everything floating upwards.” – bto: ein paar Jahre? Ja, dann sollte man jetzt voll einsteigen. Mir fehlt aber der Glaube. Warum? Nun dazu ein Abschlussbild:
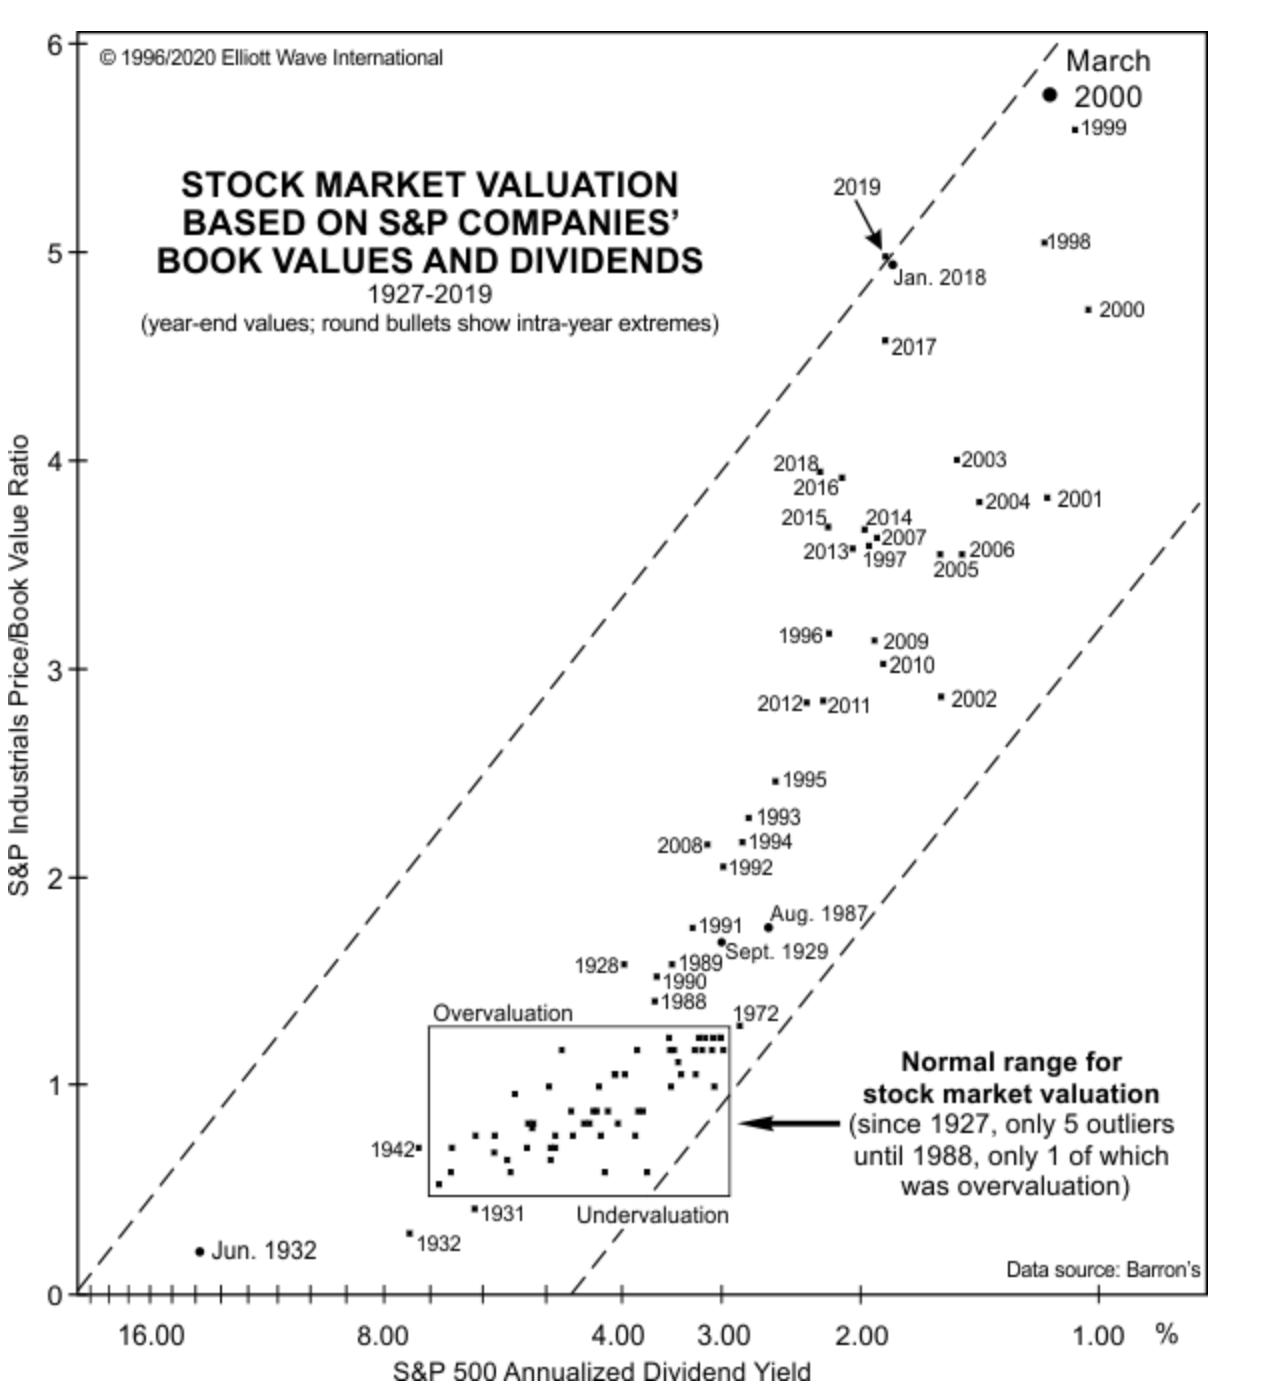
Quelle: Eliott Wave International
→ Bloomberg: “It’s a Tidal Wave of Liquidity. And Waves Crash.”, 10. Januar 2020