Staatshaushalt: Mindestens 58 Milliarden müssten wir ab sofort sparen
→ Bundesfinanzministerium: “Vierter Bericht zur Tragfähigkeit der öffentlichen Finanzen”, 2016
Nicht nur die Bundesregierung lässt rechnen (ohne die Schlussfolgerungen daraus zu ziehen), auch die EU. Deshalb heute der Bericht der EU-Kommission. Schlechte Nachricht 1: Auch laut EU haben wir eine Lücke. Schlechte Nachricht 2: In den meisten anderen Ländern sieht es nicht besser aus.
Schauen wir es uns an:
Zunächst die Feststellung, dass die meisten Bevölkerungen in den kommenden Jahren schrumpfen. Große Gewinner sind UK und auch Frankreich. Besonders dramatisch ist der Rückgang der Erwerbsbevölkerung:

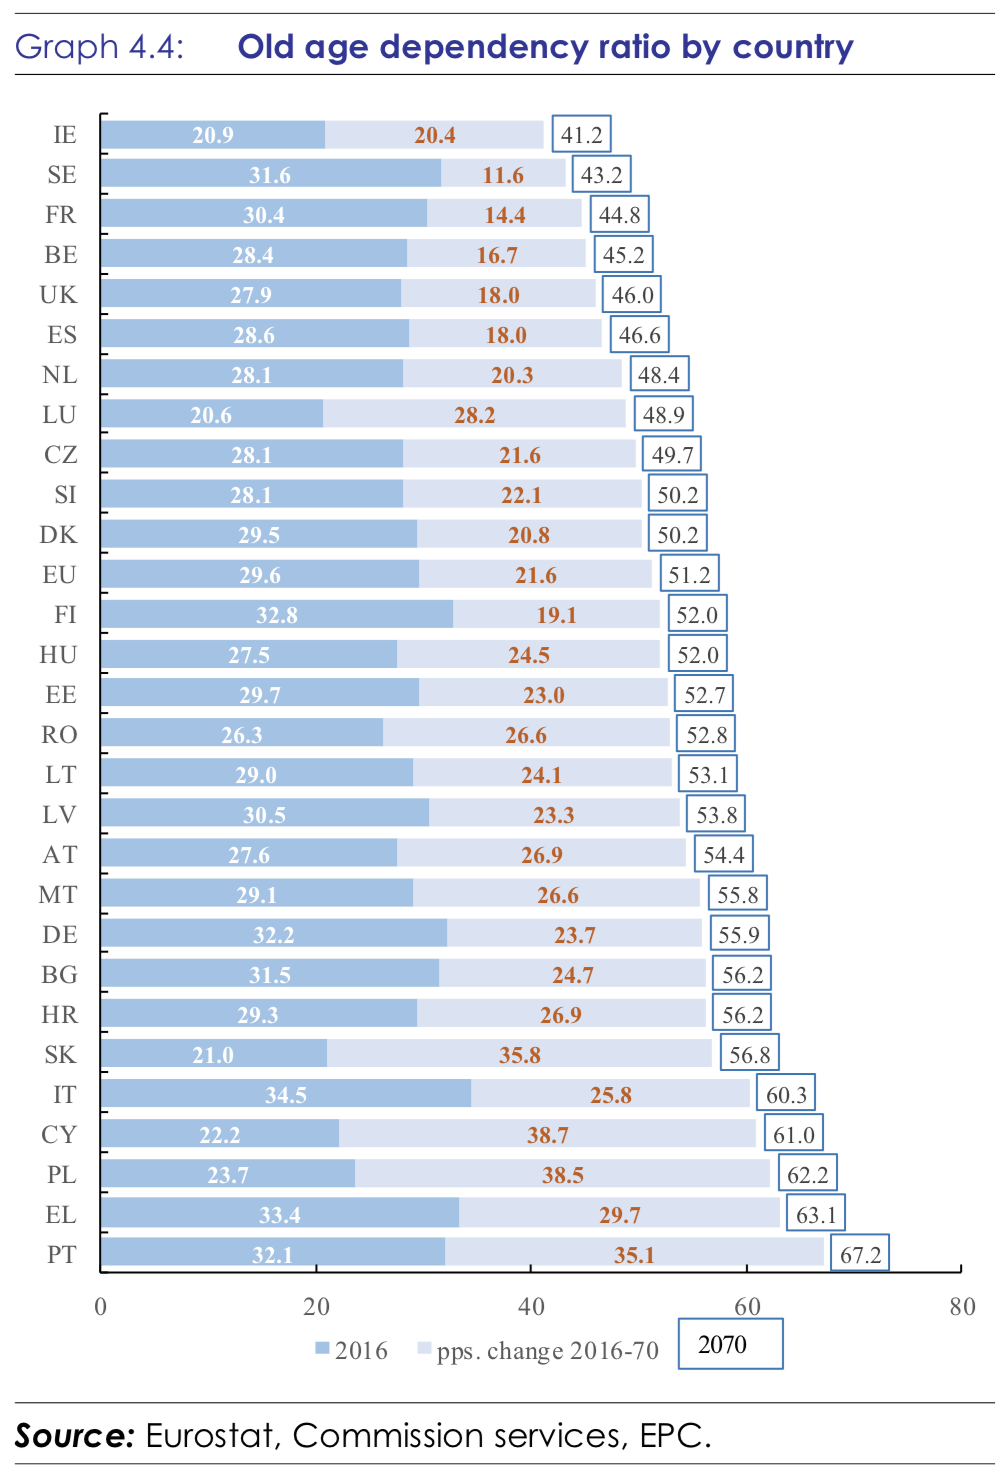
Dann die wenig verwunderliche Folge, dass immer mehr Alte von den Aktiven finanziert werden müssen: “The old age dependency ratio, population aged 65 and over as a proportion of the population aged 15-64, will rise from a value of 30% in 2016 to 51% in 2070(with a peak of 52% in 2060). In the euro area, the ratio will be 31% and 52%, in 2016 and 2070, respectively. Most of this increase is driven by the very old-age dependency ratio (people aged 80 and aboverelative to those aged 15-64) which is rising by 14 pps. (8% to 22%) over this horizon.”
Wichtig hier: Welche sonstigen Belastungen muss diese junge Generation noch schultern? Zuwanderung in Sozialsysteme? Überstürzte Energiewende? Denn diese Lasten kommen zusätzlich auf die junge Generation zu, die zudem stärker aussieht, als sie ist. Da ist zum einen der hohe Anteil mit Migrationshintergrund, der im Schnitt weniger gut ausgebildet ist, weniger arbeitet und verdient. Da ist zum anderen der Niedergang des Bildungswesens bei gleichzeitig verfallender Infrastruktur.
So oder so hat dieser Wandel eine negative Wirkung auf die wirtschaftliche Entwicklung: “The reduction in working-age population will put pressure in the labour supply that will fall accordingly. Working longer and more, with an increase in participation rates especially of older population, may not be enough to compensate for the drop in working-age population. (…) In the EU, participation rates is projected to increase over the long term, from 77.5% in year 2016 to 80.7% in 2070 for the group 20-64. The increase would be more intense for women (from 71.4% to 76.9%) and older people 55-64 (from 59.1% to 71.3%). The employment rate would increase accordingly in the population group 20- 64, with an increase for the European Union of 4.7 pps., from 71.1% in 2016 to 75.8% in 2070. The net effect of declining working-age population and higher employment rates is still negative for employment in the European Union (…).” – bto: Auch das ist alles bekannt.
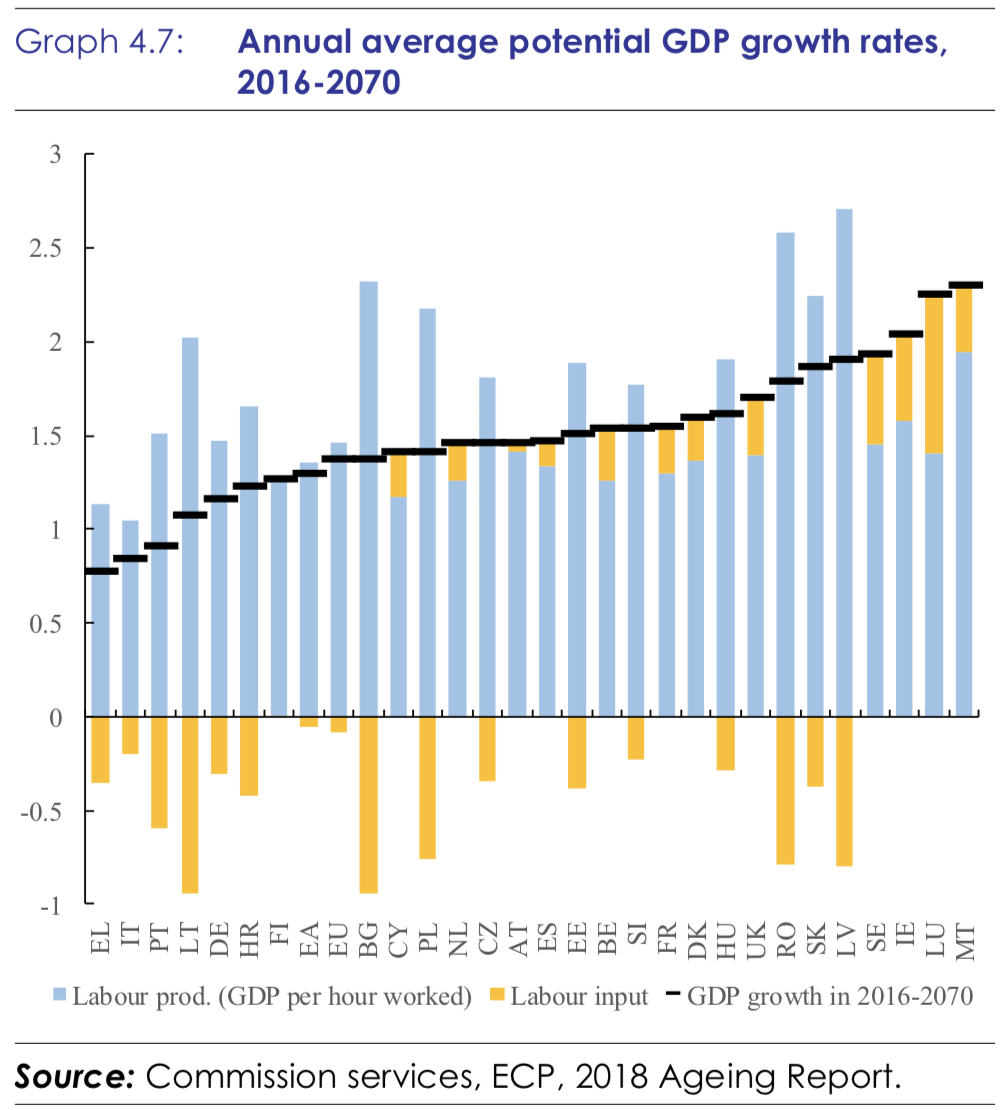
Führt zu der Frage, ob die Produktivität entsprechend steigt, um das zu kompensieren: “In the (…) baseline projection, it is assumed that all countries will converge to a labour productivity growth rate of 1.5% in the long term (corresponding to a TFP growth rate of 1%). (…) This assumption could be on the optimistic side, given historical trends in TFP growth. A risk scenario was therefore carried out, where convergence to a labour productivity growth rate of 1.1% was assumed instead (TFP growth of 0.8%).” – bto: Zurzeit haben wir immer geringere Produktivitätszuwächse und Bildung. Und fehlende Investitionen sprechen eher für geringere Zuwächse in der Zukunft. Man beachte, wie mau die Wachstumsaussichten für Deutschland sind:
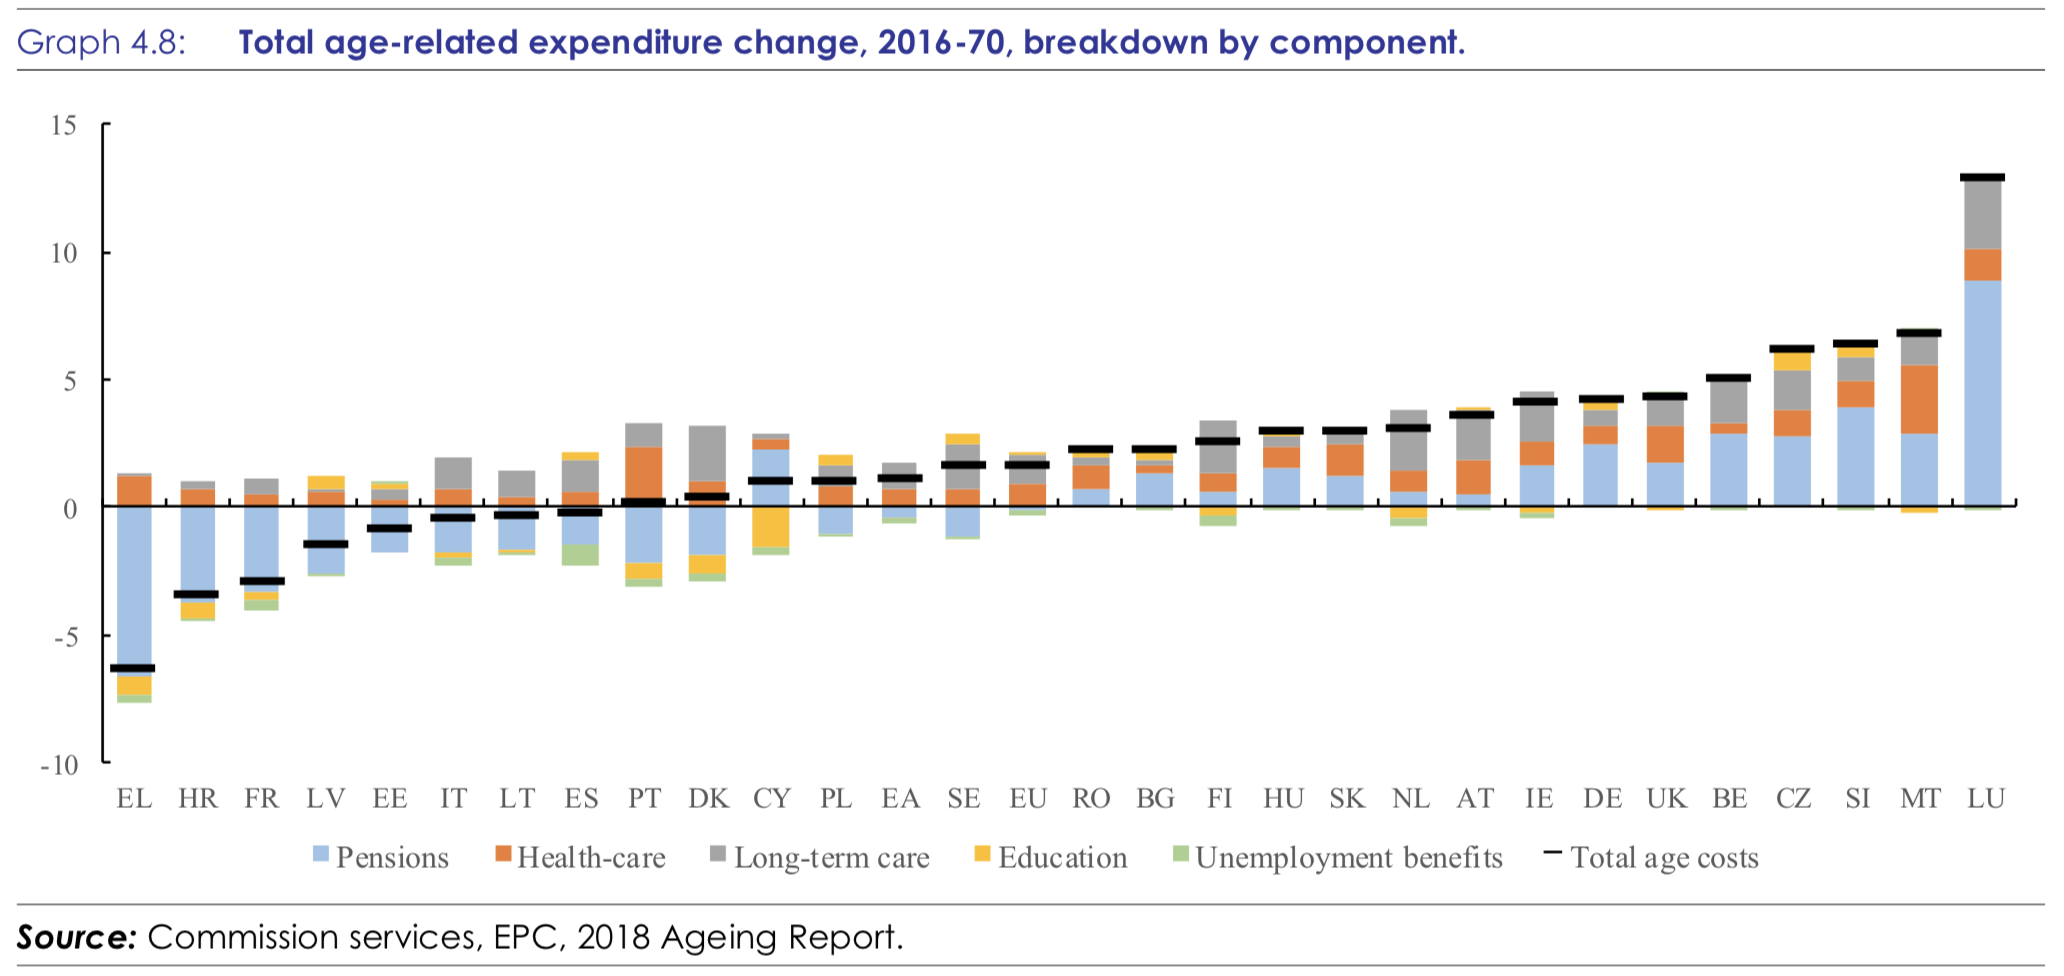
Und dann kommen wir zur einfachen Mathematik: “The ageing process has a direct effect on the public finances and will lead to higher age- related expenditure. In the European Union, total ageing cost as percentage of GDP (incorporating pensions, healthcare, long-term care, education and unemployment benefit projections) will increase by 1.7 pps. in the period 2016-2070, from 25.0% to 26.6% (see Graph 4.8).”
Kommen wir nun zu den Folgen für die öffentlichen Haushalte: “Fiscal sustainability in the long term relates to the achievement of the government’s intertemporal budget constraint. This constraint, which is also known as the solvency condition, refers to the capacity of a country to meet its net debt obligations, over an infinite horizon, with a stream of future primary surpluses. Other things equal, the greater the projected cost of ageing, the more difficult it is to fulfil the intertemporal budget constraint, as higher revenue (in present terms) is required to cover these additional costs, in addition to the other non-interest expenditure and the cost of servicing the outstanding debt.”
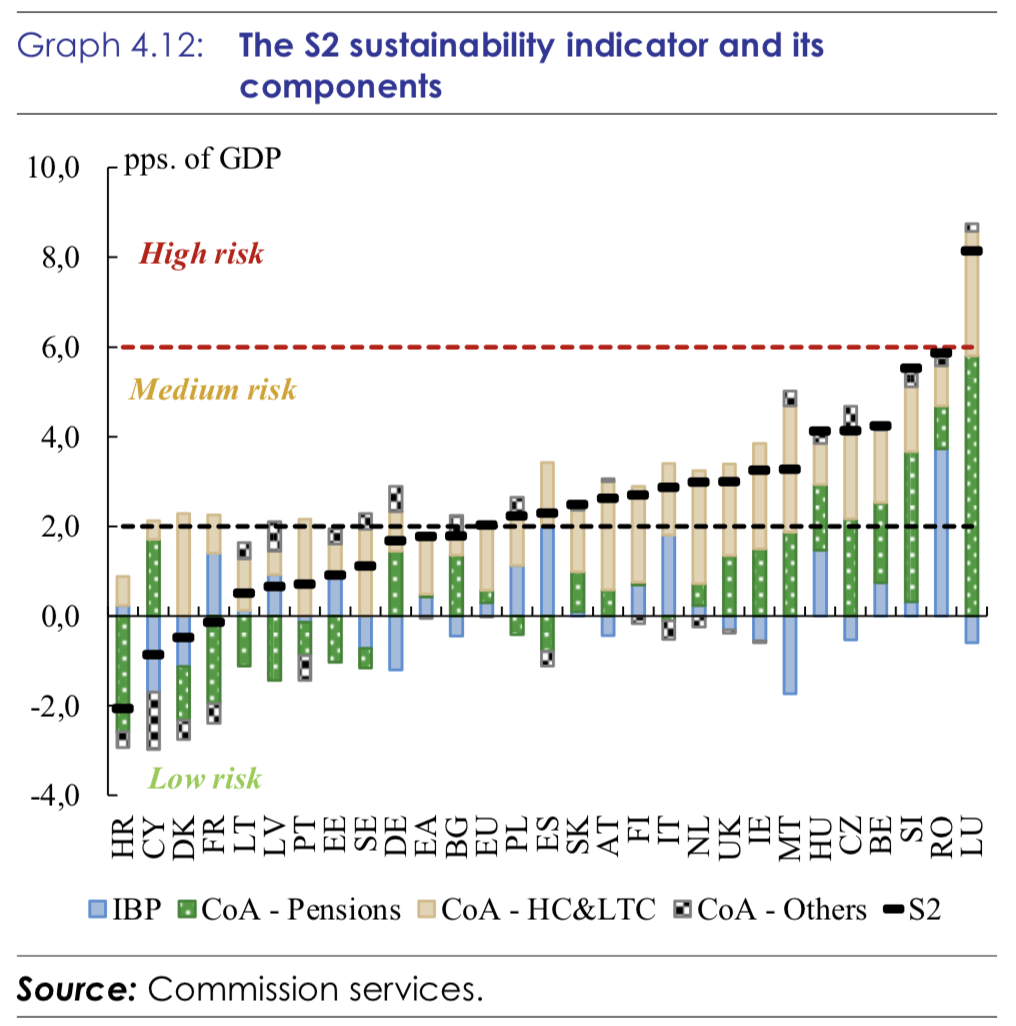
“The S2 indicator is the central element of the long-term sustainability analysis. Using the infinite version of the government budget constraint, the S2 fiscal sustainability gap indicator measures the budgetary adjustment that would ensure sustainable public finances in the long term. Specifically, this indicator shows the upfront adjustment to the current structural primary balance(subsequently kept constant at the adjusted value forever) that is required to stabilise debt-to- GDP ratio over the infinite horizon, taking into account also any additional expenditure arising from an ageing population that, over time, add up to the current structural primary balance.” – bto: Also ist es der Betrag, den ich heute zur Seite legen müsste, damit es in Zukunft zu keinem weiteren Anstieg der Ausgaben kommt.
“The S2 indicator points to sixteen Member States at high or medium fiscal risk in the long term. (…) Graph 4.12 shows for each Member State a disaggregation of the S2 indicator in terms of the initial budgetary position (IBP) and the three components of the long-term cost of ageing (CoA), namely pensions, healthcare, long-term care, and other determinants. The negative contribution of government spending on health and long-term care to the sustainability gap is particularly high (…). – bto: Da könnten unsere Politiker jetzt sagen, dass wir, verglichen mit den anderen, gut dastehen. Nur ist das zum einen nicht der richtige Vergleich, zum anderen dürften gerade die neuesten Zusagen die Finanzierungslücke dramatisch vergrößert haben. Außerdem sind die Haushaltsüberschüsse einer einmaligen, nicht nachhaltigen wirtschaftlichen Lage geschuldet. Gepaart mit den unzureichenden Investitionen ergibt sich wohl ein deutlich schlechteres Bild.
Wie schlecht es um Deutschland steht, sieht man daran, dass wir einen erheblichen Gap haben, obwohl wir im laufenden Haushalt die „schwarze Null“ feiern. Nehmen wir diese als das, was sie ist, nämlich eine vorübergehende Lage, die zudem nicht genutzt wurde, dann liegt die Lücke deutlich höher:

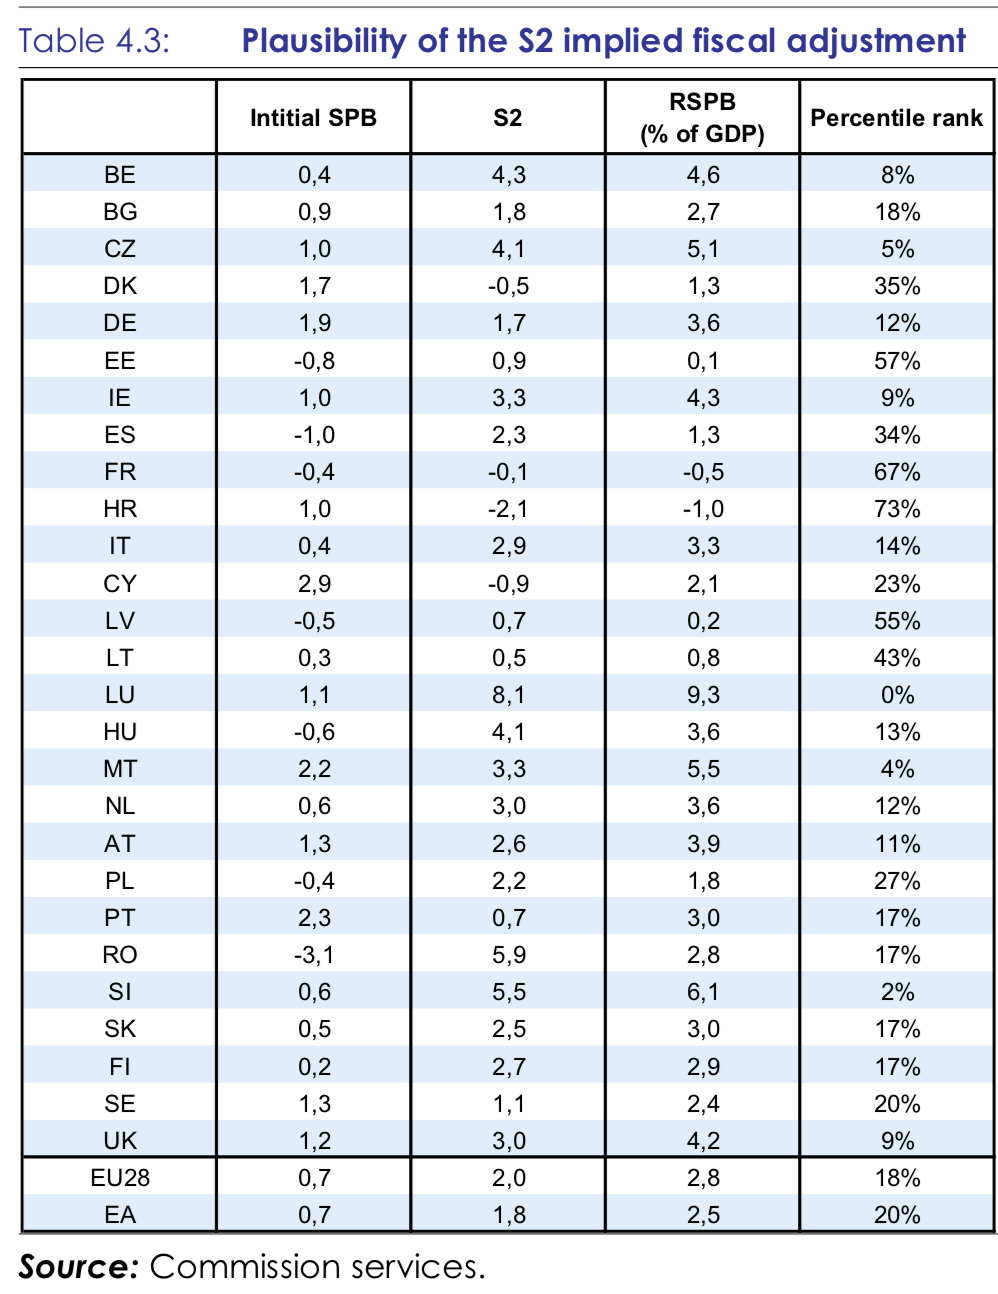
Entsprechend mehr müssten wir zur Seite legen: “The overall size of the required structural primary balance (RSPB) is informative about the overall fiscal policy that needs to be sustained to close the sustainability gap. The RSPB is the sum of the structural primary balance in 2020 (i.e. end of forecast period) and the required additional effort measured by S2 to stabilise the debt ratio in the long term. (…) The percentile rank of the RSPB implied by the S2 indicator gives an indication of the degree of the plausibility of the implied adjustment. The RSPB can be benchmarked to the history of primary balances in the EU, hence allowing an assessment of how common (or uncommon) the fiscal position assumed in the projections is, relative to the structural primary balance distribution for all EU countries over 1980-2018. In particular, it indicates where a very large primary balance implied by the S2 is unlikely to be sustained in the long term. The required structural primary balances appear large in BE, CZ, DE, IE, IT, LU, HU, MT, NL, AT, SI and the UK (see Table 4.3).” – bto: Wir müssen die vollen 3,6 Prozent als Basis nehmen, wenn nicht sogar mehr. Übrigens, 3,6 Prozent entsprechen 122 Milliarden, 1,7 Prozent (wenn wir die schwarze Null als nachhaltig betrachten, was sie bekanntlich nicht ist) 58 Milliarden.
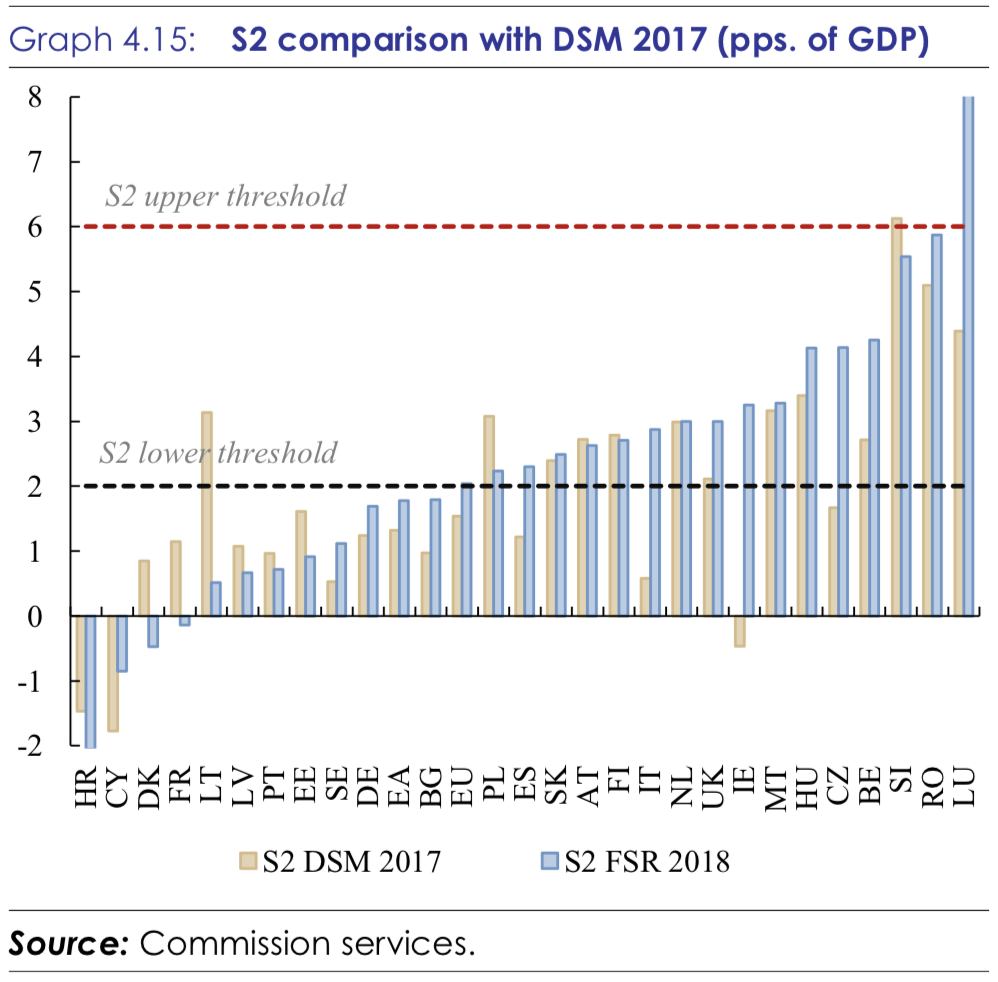
Zur Politik: Die nächste Abbildung zeigt nochmals, dass wir, verglichen mit den anderen (Bankrotteuren), besser dastehen. Aber sie zeigt auch, wie schnell sich das Bild verschlechtern kann (Italien!!) und, dass man bei uns in der falschen Richtung unterwegs ist:
Fazit: Es ist und bleibt ein Märchen vom reichen Land, das uns regelmäßig aufgetischt wird. Die Sozialausgaben steigen schon in den guten Zeiten und verschlechtern die Aussichten für die Zukunft weiter. Da nutzt es uns wenig, dass unsere Partner zur Lösung ihrer Probleme mehr Geld von uns wollen. Im Gegenteil!