Noch ein paar Charts zu den Märkten
In der letzten Woche habe ich mich bei bto mit der Bewertung der Märkte auseinandergesetzt. Richtigerweise haben mich mehrere Leser daran erinnert, dass ich – und andere – das schon 2015 geschrieben haben. Und es geht weiter aufwärts. Vermutlich müssen wir alle zu Bullen werden. Wie in diesem Zitat aus einem weiteren kritischen Beitrag zum Markt:
“It is a bad sign for the market when all the bears give up. If no-one is left to be converted, it usually means no-one is left to buy.” – Pater Tenebrarum
Noch ist es wohl nicht so weit. Und vielleicht kommt es noch lange nicht dazu, gibt es doch noch genügend Skeptiker. Schaut man sich die Zahlen an, kann man allerdings schon Zweifel bekommen:
- “The lack of volatility, flood of liquidity from Central Banks, and a seemingly ‚bullet-proof‘ rise in the market has boosted investor confidence to exuberant levels. That consistent push higher, without a correctionary process along the way, has pushed the market into ‚extremely overbought, extended, and bullish territory‘ .”
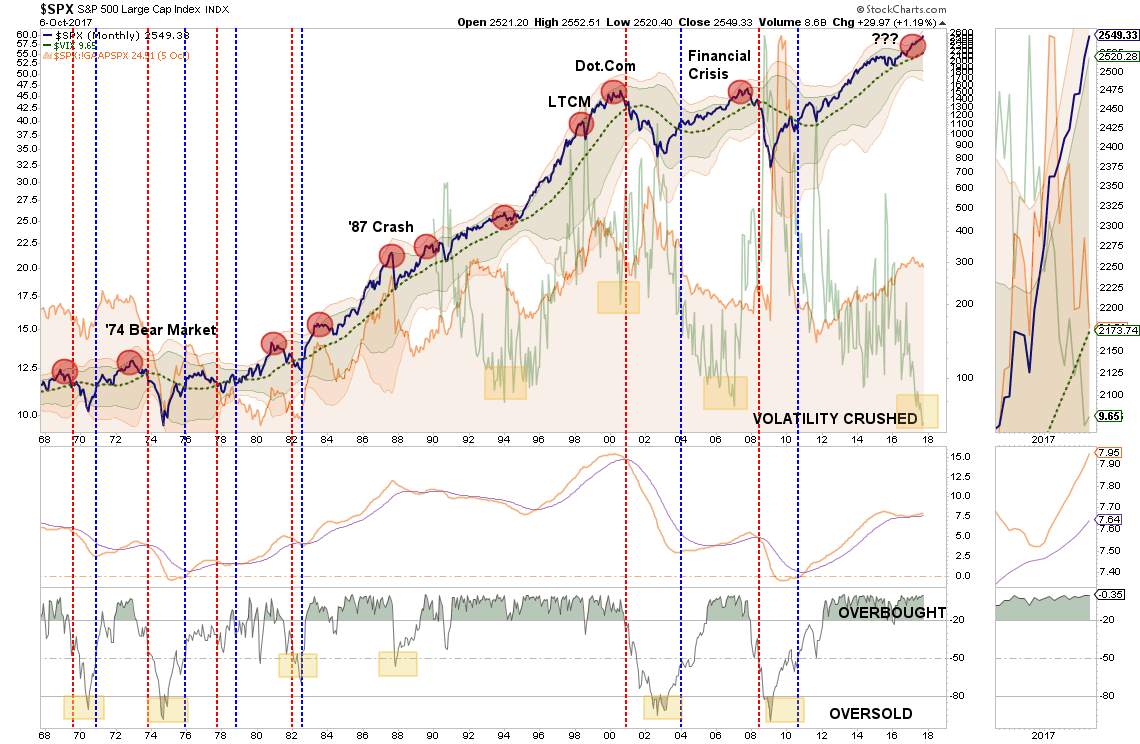
Quelle: Real Investment Advice
- “The average correction that resolved the overbought condition, since the end of the last financial crisis, has been as little as -3% but as much as -19%. It is for this reason that I continue to suggest NOT chasing the markets at the current time. There will be a correction of some magnitude in the near future that will allow for a safer entry of new capital into the markets. Patience, however, will likely be tested before that opportunity presents itself.“ – bto: Und das macht es natürlich so schwer.
- “For the stock market (…) the standard deviation is measured is with Bollinger Bands. John Bollinger, a famous technical trader, applied the theory of standard deviation to the financial markets.Because standard deviation is a measure of volatility, Bollinger created a set of bands that would adjust themselves to the current market conditions. When the markets become more volatile, the bands widen (move further away from the average), and during less volatile periods, the bands contract (move closer to the average). The closer the prices move to the upper band, the more overbought the market, and the closer the prices move to the lower band, the more oversold the market.” – bto: was bis hier nur zeigt, dass wir uns in einem Trendkanal nach oben bewegen.
Quelle: Real Investment Advice
-
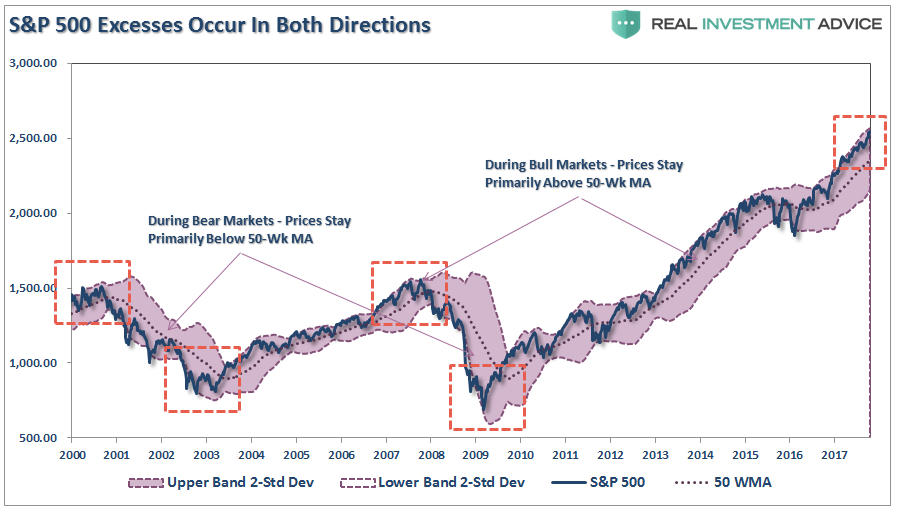
“The dashed purple line is the 50-week moving average (or mean) with shaded area representing 2-standard deviations. As shown in the chart above, 2-standard deviations encompass 95.4% of all probable price movement.Even during the 2012-15, QE3 driven, stock advance, there were several corrections back to the 50-week moving average which allowed for increases in equity risk.” – bto: Übersetzt soll dies wohl heißen, es kann zumindest eine kleine Korrektur geben.
-
“However, if the markets are building a longer term top then a reversion past the 50-week moving average will denote a possible change into a bear market. Bull and bear markets are denoted below by how they trade either above or below the 50-week moving average.” – bto: Und man kann klar sagen, dass es ein großes Top wäre, so es denn erreicht ist.

Quelle: Real Investment Advice
- “The chart below shows the monthly level of bullish outlooks according to our composite indicator of both individual and professional investors.”
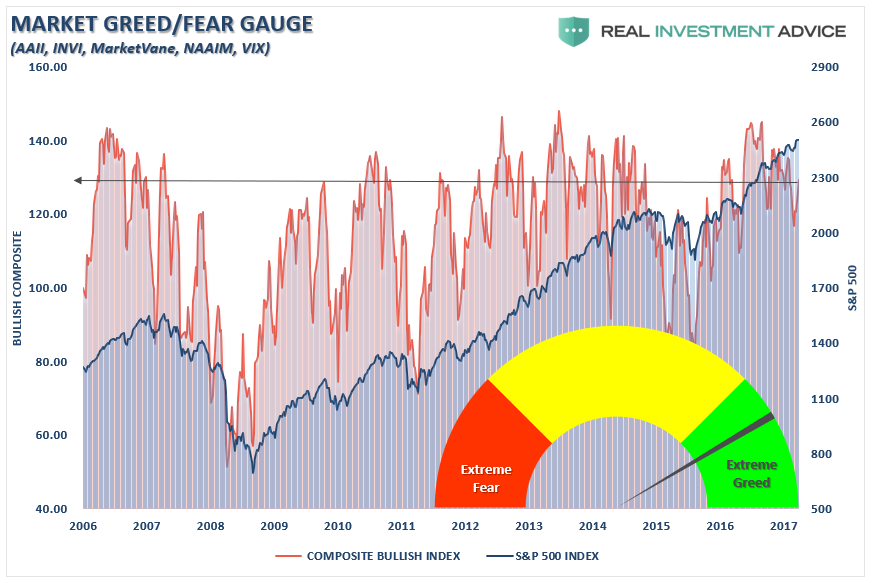
Quelle: Real Investment Advice
- “The extraordinarily low level of ‚bearish‘ outlooks combined with extreme levels of complacency within the financial markets has historically been a ‚poor cocktail‘ for future investment success. (…) For now, holding a little extra cash certainly won’t detract significantly from portfolio performance but will provide an opportunity to take advantage of panicked sellers later. It’s not a question of ‚if‘ only of ‚when‘.” – bto: einverstanden!