Ein Blick auf die Bewertung der US-Börse
Immer wieder habe ich an dieser Stelle die (zu hohe) Bewertung der US-Börse diskutiert. Dies trotz der allgemeinen Auffassung, dass in einer Welt, die immer weiter in Eiszeit und Negativzins absteigt, Aktien der einzige sichere Hafen seien und damit wohl jeden Preis rechtfertigen.
In einem günstigen Szenario bedeutet dies geringe Erträge auf lange Sicht, im ungünstigen Fall deutliche Korrekturen mit für Investoren schmerzhaften Verlusten. Grund genug, doch gelegentlich auf die Fundamentaldaten zu blicken, wie es John Authers in einem seiner letzten Newsletter tut:
- “In the very long term, stocks are driven by fundamentals – economic growth, earnings, and assets. That is why valuations comparing share prices to various slowly changing trackers of fundamentals are taken seriously by asset allocators.” – bto: Obwohl alle wissen, dass diese Faktoren für kurzfristige Entscheidungen nicht taugen. Schließlich können sich die Märkte sehr lange von den fundamentalen Faktoren entfernen.
- “But what happens when we revise the fundamentals? And how can fundamentals even be measured in an era where assets tend to be ever less tangible, and to be tied up instead in more nebulous qualities such as intellectual property and brands?” – bto: Ich erinnere in diesem Zusammenhang an die immer größere Bedeutung von erworbenem Goodwill auf den Bilanzen. Hier schlummert gerade auch in Deutschland ein erhebliches Risiko.
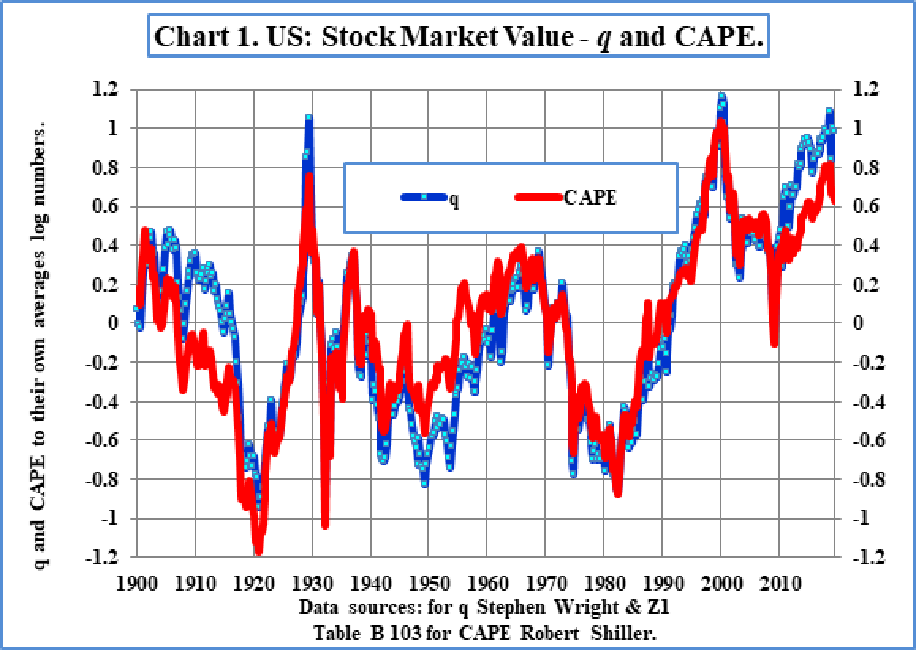
- “That issue now confronts the measure known as Tobin’s q – a concept coined by the Yale University Nobel laureate economist James Tobin which refers to the ratio of a company’s market value to the replacement value of its assets. Over history (…) q is the most effective long-term valuation metric, followed by the cyclically adjusted price/earnings multiple (CAPE) (…) Neither measure is of any use for timing, but they both do a great job of predicting subsequent returns over 10 years or longer.” – bto: Leser dieser Seiten kennen das Konzept aus verschiedenen Beiträgen. Letztlich läuft es auf die triviale Feststellung hinaus, dass im Einkauf der Gewinn liegt. Das zeigt auch Authers mit dieser Darstellung, die wir ähnlich auch bei Hussman und anderen gesehen haben.
Quelle: Bloomberg
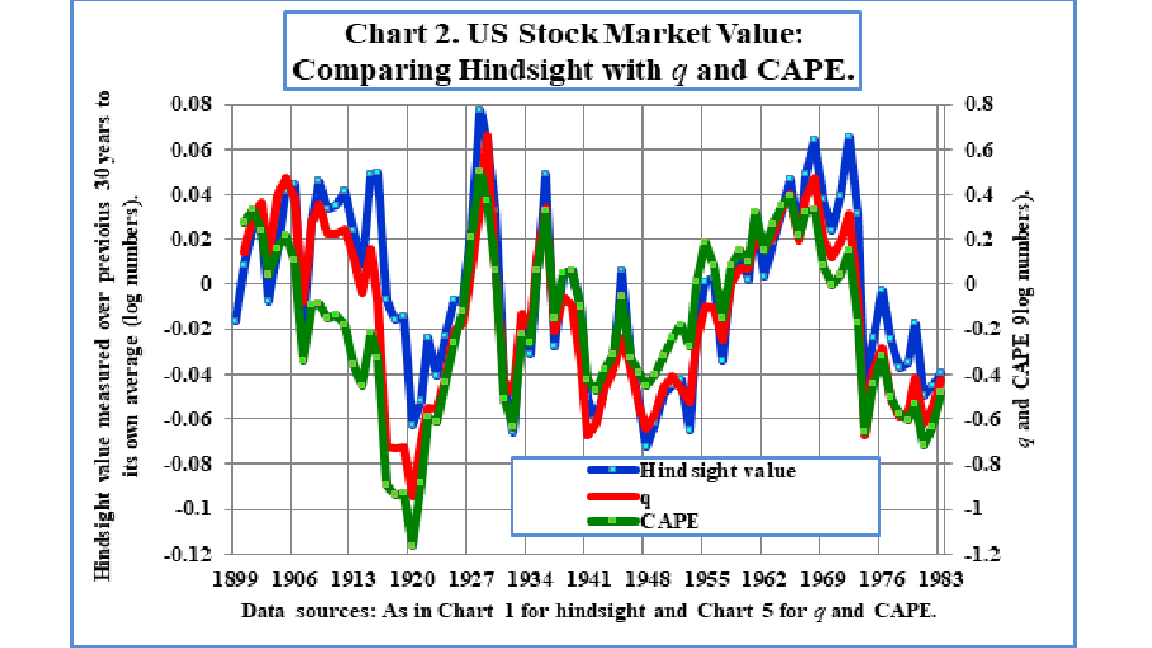
- “Both are startlingly accurate, but q has worked better. This may well be because CAPE relies on numbers produced under accruals accounting, which might be systematically distorted. But recently, the National Income and Product Account (NIPA) numbers that make up the denominator in q, produced by the Bureau of Economic Analysis as part of the national GDP numbers, received a drastic revision.” – bto: und zwar in die falsche Richtung. Wenn die Assets weniger werden und die Verbindlichkeiten mehr, ist das eine doppelte Verschlechterung der fundamentalen Daten. Demzufolge sind Aktien noch teurer oder aber sie müssten nach der Veröffentlichung der Daten fallen.

Quelle: Bloomberg
- “The result is to reduce U.S. non-financial companies’ net worth by 58%. The lower denominator means that q now shows the stock market to be more overvalued compared to history than CAPE does.” – bto: und zwar auf einem Niveau, das über 1929 und nur geringfügig unter der Dotcom-Blase liegt.
Quelle: Bloomberg
- “If you feel bearish, this implies that U.S. stocks are even more overvalued than we thought. By Smithers’ calculations, non-financial companies were overvalued by 88% according to q at the end of the second quarter before the revisions. Post-revision, that number rose to 167% overvaluation. If you feel bullish, however, the fact that the denominator can be so widely revised raises questions over its usefulness. The historical record of q as a great indicator brooks little argument; and the BEA statisticians are trying to keep up with the changing nature of assets. It would be unwise to ignore the warning signal from a high q…” – bto: Dem kann man nur zustimmen. Denn wie immer ist es gefährlich, zu der Schlussfolgerung zu kommen, dass diesmal alles anders sei.
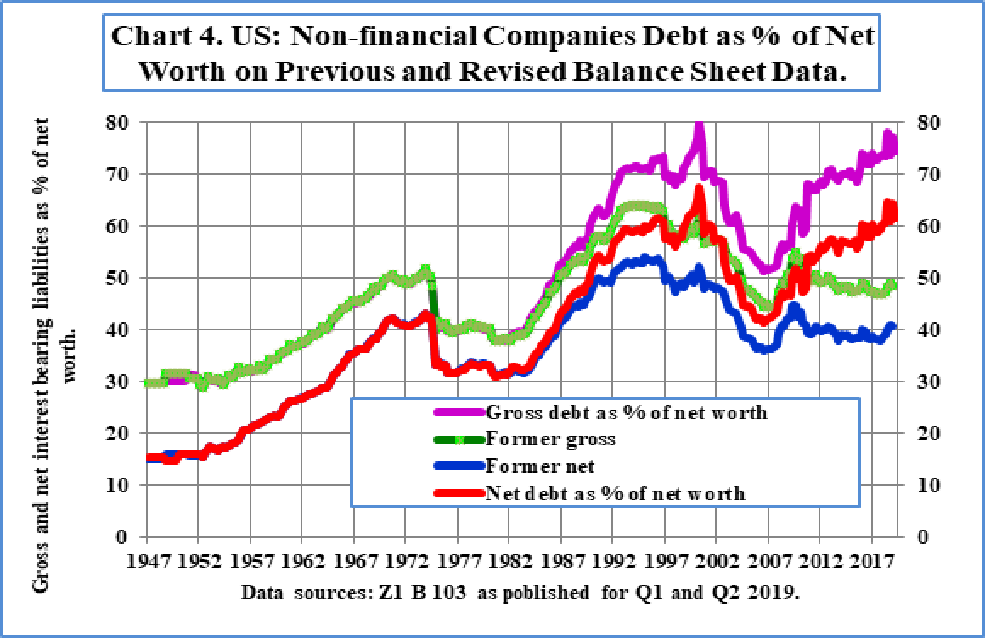
- “A nasty implication of the NIPA revisions is that U.S. companies are far more leveraged than they previously appeared. This chart, from Smithers, shows gross and net debt as a proportion of net worth under the previous numbers, and under the revisions. “
Quelle: Bloomberg
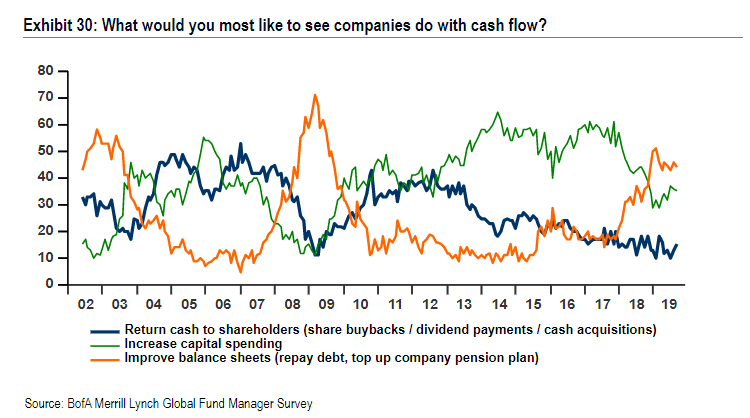
- “Suddenly leverage appears to have returned almost to its post-war high set during the dotcom bubble. That is alarming. And it has, indeed, caused alarm. One finding of the Bank of America Merrill Lynch fund manager survey is that investors have changed their preference on how companies should use cash flow.” – bto: Das ist eine entscheidende Veränderung und zeigt, dass die Börsianer doch nicht glauben, dass es diesmal anders ist.
Quelle: Bloomberg
- “(…) about 16% of big investors (…) see a bear market as quite likely. These investors believe there is safety in emerging markets (in an inflationary environment), and also trust gold. If leverage is as scary as the new NIPA numbers suggest, we can expect this group to grow.” – bto: Es bleibt so banal. Schulden sind gut, solange das Vertrauen da ist. Sobald dieses fehlt, sind die Probleme nur eine Frage der Zeit. Je länger es dann dauert, desto brutaler der Margin Call und damit die Anpassung der Vermögenswerte.