Die Inflationsrate befindet sich auf normalem Niveau
Am Montag habe ich einen Blick auf die langfristige Entwicklung von Nominal- und Realzinsen geworfen. Dabei ging es auch um die Inflation, die zwar seit Einführung des FIAT-Geldes deutlich zugenommen hat, sich jedoch im Schnitt auf rund zwei Prozent beläuft.
Inflation ist ein wichtiges Thema, diskutieren die Experten doch schon lange kontrovers, ob diese zurückkehren (kann) und wenn ja, wie stark sie ausfallen könnte.
Die Deutsche Bank trägt nun mit ein paar interessanten Charts zu der Diskussion bei. Grundaussage: Die Inflation ist da, und zwar im normalen Rahmen.
- Mythos: Inflation is low
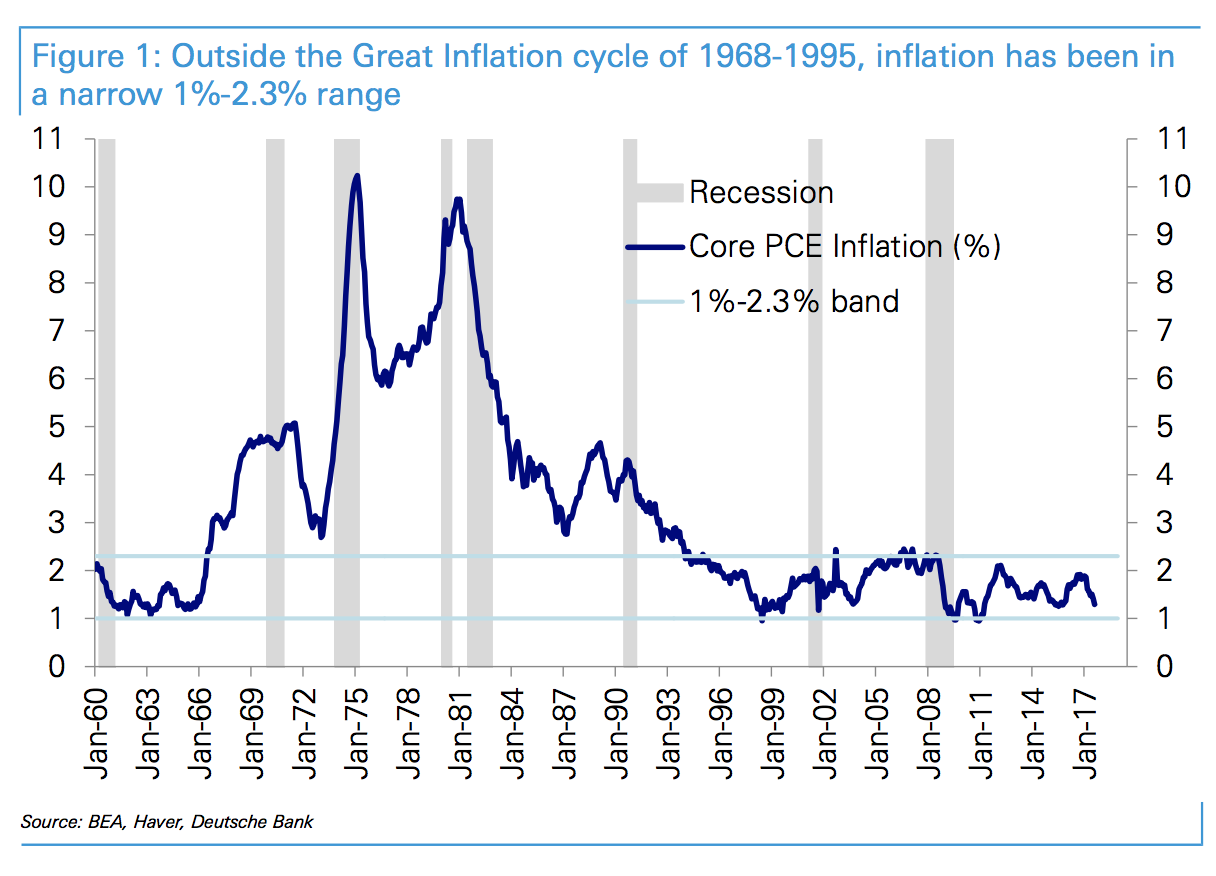
Fact: It is well within its narrow 20-year range
- “Measured by the Fed’s preferred PCE index, core inflation has remained well within the relatively narrow 1%-2.3% range it has been in for the last 20 years.” – bto: wobei wir natürlich wissen, dass die Art der Inflationsmessung umstritten ist und vermutlich zu tief liegt.
- “(…) it is important to note the Great Inflation cycle of 1968-1995, one of the longest and largest peace time inflation cycles (…) was not a desirable outcome for inflation and therefore not what one wants to compare current inflation against. In our view it is therefore appropriate to restrict comparisons of current inflation to the last 20 years, i.e., the period since 1996.” – bto: also die große Ausnahme der 1960er-Jahre. Das sind natürlich die USA. Wenn wir global schauen, gab es durchaus andere Inflationsphasen, die erhebliche Ausmaße hatten.
- “Prior to the Great Inflation cycle, during the early part of the 1960s, core PCE inflation fluctuated in a range of 1.1%-2.1%, about the same as it has done for the last 20 years.” – bto: was zu den Daten aus der Studie bei der Bank of England passt.
 Quelle: Deutsche Bank
- Mythos: Low inflation reflects structural change
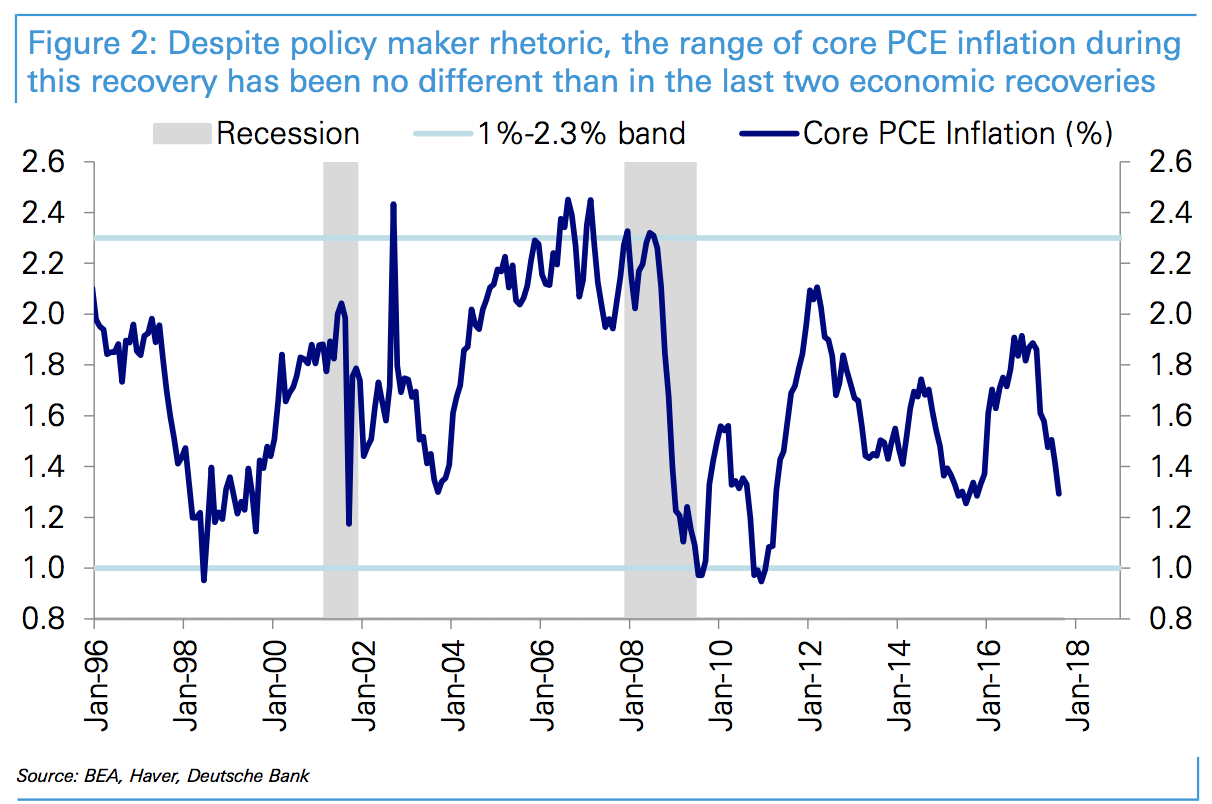
Fact: Statistically that’s impossible with inflation around 1 standard deviation (40bps) from its average over the last 20 years
- “The list of potential drivers of structural changes in the inflation process is long. The list includes globalization, the impact of outsourcing in meeting constraints on capacity and in hiring, the impacts of technological disruption that have lowered prices in various market segments, increased competitive price pressures, (…).” – bto: Die Liste möglicher deflationärer Treiber ist bekannt und lang.
- “With inflation well within its historical distribution and currently around 1 standard deviation from its mean of the last 20 years, it is impossible that there has been a statistically significant structural break in inflation in the aggregate. It is not that these changes have not occurred or that they are not having the expected impact, it is that they have not had a sizable or discernible enough impact in the aggregate (…).” – bto: Aber es ist keine Ursache für zu tiefe Inflation, denn diese ist gar nicht zu tief!
Quelle: Deutsche Bank
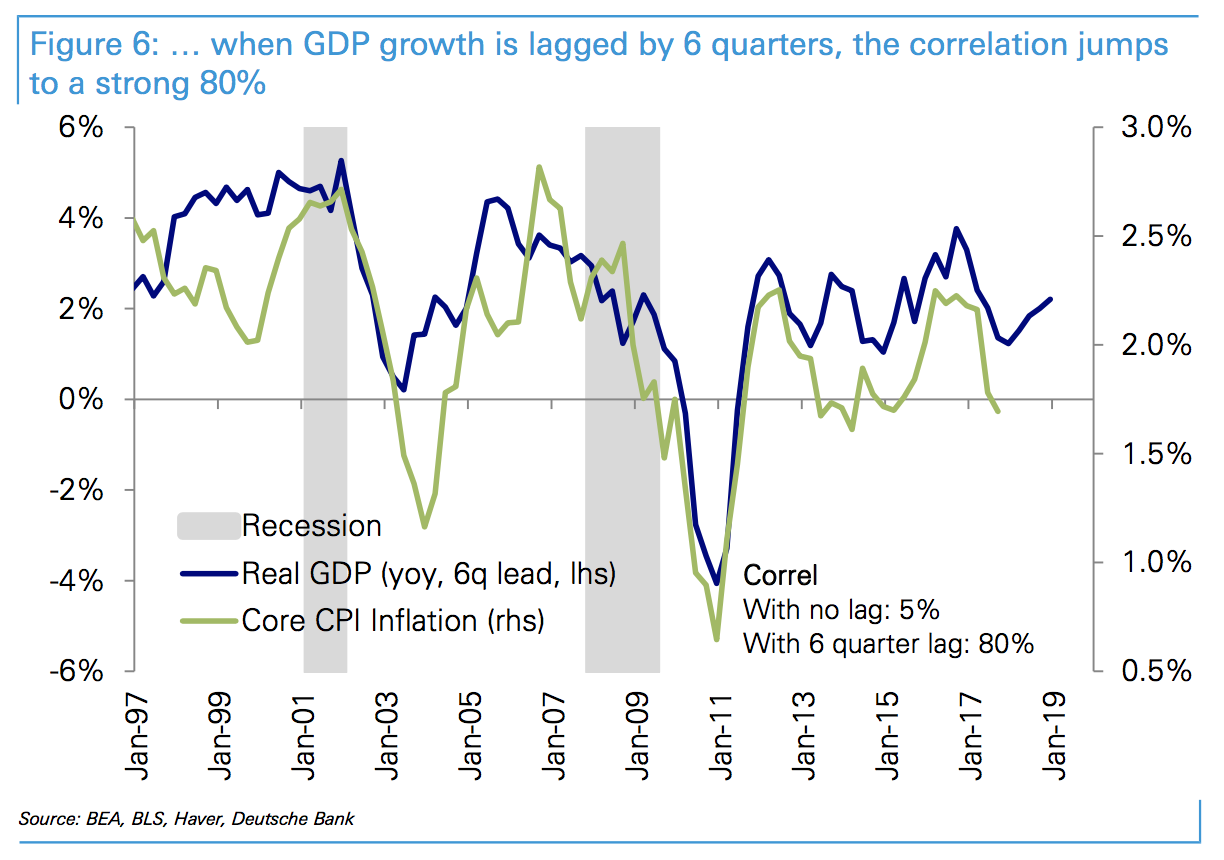
- Mythos: The recent decline in inflation is telling us something about current or future slack or growth
Fact: Inflation is a (very) lagging indicator. The recent slowdown, if anything, is telling us about the (long) past slowdown in growth
- “It is well known that inflation is slow moving and responds with long lags to changes in growth, to changes in unemployment, to the dollar and to commodity prices. For example, while the correlation between core CPI inflation and GDP growth over the last 20 years is only around 5%, when GDP growth is lagged by 6 quarters, the correlation jumps to a strong 80%. This strong correlation implies almost 2/3 of the variation in core inflation can be explained simply by lagged growth.” – bto: Es ist also ein nachlaufender Indikator, kein vorauslaufender.
- “Lagged growth is pointing to inflation turning up. GDP growth, having rebounded since the impacts of the dollar and oil shocks have dissipated, is pointing to a turn up in inflation.” – bto: Mit der Beschleunigung des Wachstums wird nun also auch die Inflation anziehen.
- Mythos: Inflation is running stubbornly below target
Fact: The Fed effectively raised its target when it adopted the PCE as its preferred measure of inflation since it systematically runs lower than CPI inflation.
- “The Fed effectively increased its inflation target by 40 bps with the adoption of the PCE as its preferred measure of inflation. (…) Over the last 20 years, core PCE has almost always run lower than the CPI, on average 40bps lower. A move from targeting CPI inflation to PCE inflation with an unchanged target thus implies an effective increase in the inflation target by the average differential. To put it another way, with an unchanged inflationary process a CPI inflation target of 2% translates to a 1.6% inflation target for the PCE since it tends to run 40 bps lower. Or to achieve a 2% inflation target for the PCE would require a 2.4% target for the CPI.” – bto: Nun könnte man meinen, es passt in das Umfeld gewünschter höherer Inflation. Doch dafür ist der Unterschied dann doch zu gering.
- “The recent experience of Japan in trying to raise inflation expectations and inflation from mild deflation to 2% as part of Abenomics is testament to the difficulty of changing inflation expectations despite draconian, coordinated, and internationally sanctioned measures to do so.” – bto: weil wir eben doch deflationäre Gegenwinde haben.
 Quelle: Deutsche Bank
- Mythos: The decline in inflation expectations reflects deep deflationary forces
Fact: It is easily explained by the US dollar and oil shocks of 2014
- “Empirically, it follows that changes in inflation expectations over time have a 1-for-1 impact on actual inflation. So a 1 percentage point increase in inflation expectations should be expected to lead to a 1 percentage point increase in inflation over time and the empirical evidence is that they do.” – bto: Die Erwartungen werden erstaunlich gut formuliert.
- “So the falloff in inflation expectations beginning in mid-2014 is potentially concerning, but it looks to simply reflect the US dollar and oil shocks which have dissipated. (…) With the impacts of the dollar shock having dissipated on US growth and earnings, we expect it will also pass through inflation and inflation expectations.” – bto: also kein struktureller, sondern ein taktischer Faktor.
- Mythos: The Phillips curve is broken
Fact: It is not. But unemployment is not the only driver of inflation and certainly not the most important
- “There has been much discussion about whether the traditional Phillips curve relating inflation to the output or unemployment gap has “flattened” or “broken” in recent years..(…) The “flattening” or “breaking” of the Phillips curve in this cycle describes the fact that after being relatively closely correlated in the previous cycle (-77%), core PCE inflation has been much less correlated (-21%) in this cycle.” – bto: was die große Diskussion ist. Die Deutsche Bank meint aber, es läge an anderen Faktoren.
- “But inflation does not depend only on unemployment. Other drivers, especially in our view the dollar, have mattered. (…) Indeed core PCE inflation has been robustly and strongly negatively correlated with the dollar (-44) (…).” – bto: Der Wechselkurs als erheblicher Bestimmungsfaktor leuchtet sicherlich ein.
- “The Phillips curve—augmented with the dollar—has not flattened or broken. Including the dollar along with the unemployment gap to explain core PCE inflation dramatically improves the fit (61%) and the responsiveness of inflation to unemployment which we see as in line with various other historical estimates (…).” – bto: also auch das nur eine normale Fluktuation.
Quelle: Deutsche Bank
Fazit: Die Inflation befindet sich in normalem Rahmen und wir haben weder außergewöhnlich hohe, noch außergewöhnlich tiefe Inflation. Ob dies so bleiben wird, kann man aus dieser Analyse jedoch nicht schließen.
Und hier die ganze Studie: DB_Inflation