Das Schuldenmonster wächst ungebremst
Vor sieben Jahren erschien mein Buch → “Die Billionen-Schuldenbombe”.
Und diese tickt weiter. Die Optimisten zucken die Schultern und sagen: So what, lass die ticken, denn die hat ja keinen Zünder. Ich bleibe skeptisch, vor allem, wenn ich sehe, welche Dynamik die Schuldenbombe entwickelt. Die neuesten Daten des Institute of International Finance IIF zeigen, wie das Problem anwächst:
Die “Highlights”:
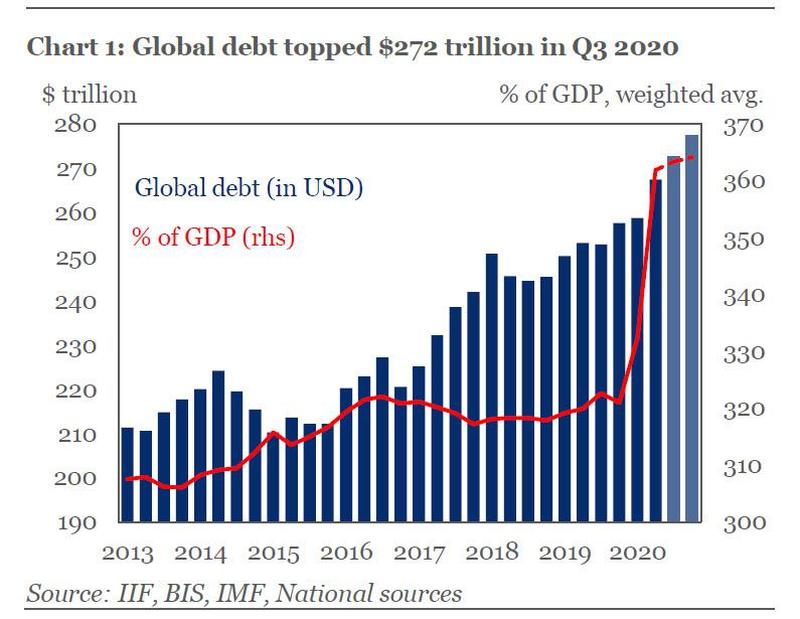
- “Global debt has surged by over $15 trillion since 2019, hitting a new record of over $272 trillion in Q3 2020.
- As the fiscal response to the pandemic continues, the IIF expects global debt to hit $277 trillion (365% of GDP) by end-2020
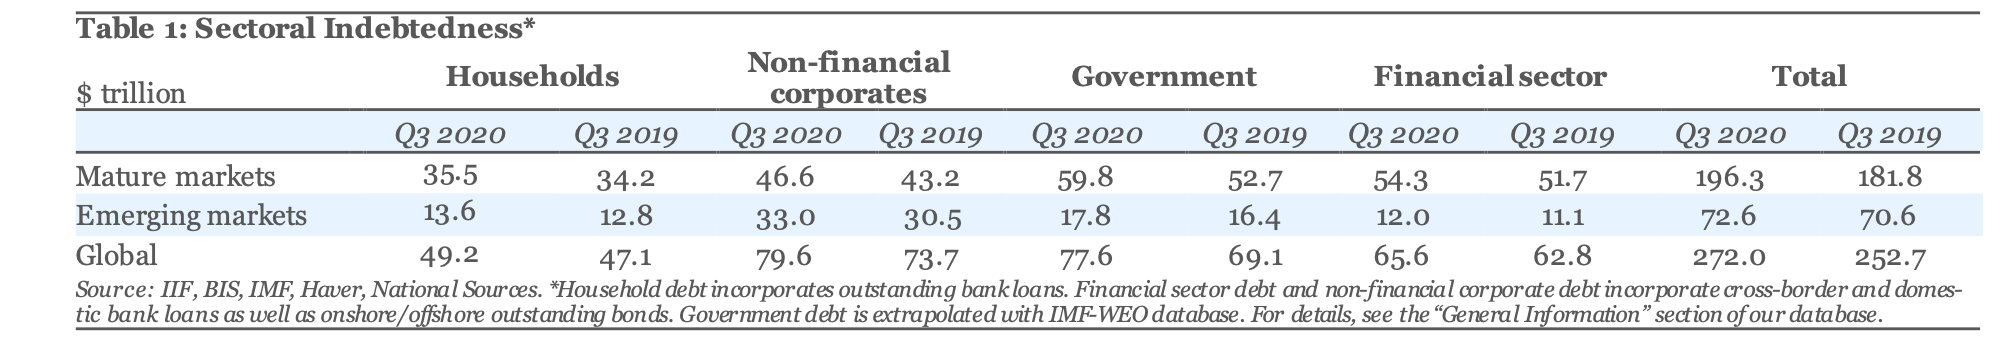
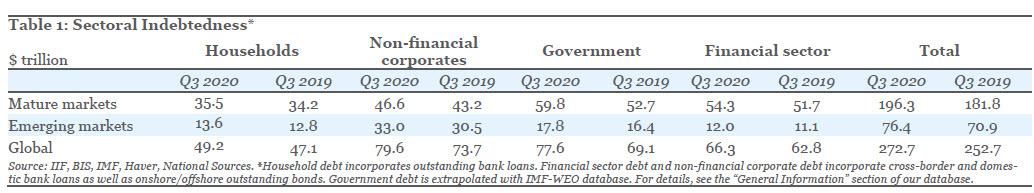
- Debt outside the financial sector on track to hit $210 trillion (274% of GDP) this year—up from $194 trillion (240%) in 2019
- Emerging market debt (ex-financials) is fast approaching 210% of GDP—up from 185% in 2019 and 140% a decade ago
- Sharply declining revenues have made debt service much more onerous for EM governments—despite low borrowing costs
- Some $7 trillion of emerging market bonds and syndicated loans come due through end-2021, 15% of that in U.S. dollars.”
– bto: Das sind ja nur Zahlen, die angesichts der Corona-Krise nicht verwundern können. Sie zeigen aber, welche Probleme sich perspektivisch aufbauen und damit auch den Druck auf “kreative Lösungen” erhöhen.
- According to IIF calculations, global debt is on track to exceed $277 trillion in 2020: Spurred by a sharp rise in government and corporate borrowing as the COVID-19 pandemic wears on, the global debt load increased by $15 trillion in the first three quarters of 2020 and now stands above $272 trillion. Much if not all of that increase was monetized by central banks who have now activated the disaster contingency plan known as helicopter money. And with little sign of a slowdown in debt issuance, the IIF estimate that global debt will smash through records to hit $277 trillion by the end of the year.” – bto: Damit wächst auch der Druck auf die Notenbanken, den entscheidenden Schritt zu gehen.
Quellen: ZeroHedge, IFF
- “Debt-to-GDP ratios has gone parabolic: Following a record surge in global debt-to-GDP (from 320% to around 362% in H1 2020) (…) A more granular look reveals that debt in mature markets surpassed a record 432% of GDP in Q3 2020, up by over 50 percentage points from 2019. The U.S. accounted for nearly half of the rise, with total debt on track to hit $80 trillion in 2020—up from $71 trillion in 2019. Most of the rise was in the general government (up $3.7tn) and non-financial corporate sectors (up $1.7tn). In the Euro Area, a $1.5 trillion rise in government debt pushed total debt over $53 trillion in Q3 2020 (though this is still below the all-time high of $55 trillion in Q2 2014). Debt in other mature markets rose by over $3.7 trillion to $65 trillion in the first three quarters of 2020.” – bto: Mit hohen Schulden in die Krise zu schlittern und diese mit weiteren Schulden zu bekämpfen, muss sich so niederschlagen.
Hier die Zahlen nach Sektoren:
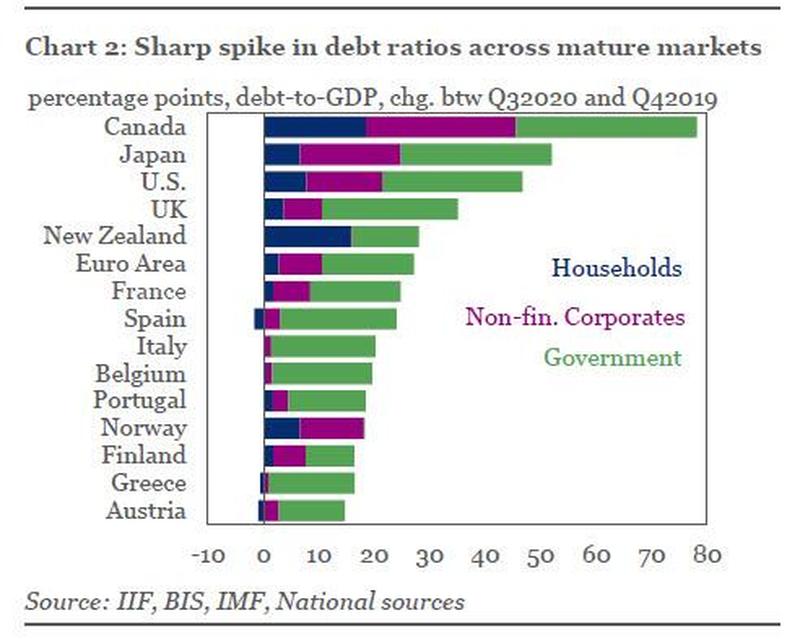
- “The US, Canada and Japan have seen the biggest increases in non-financial sector debt this year, with the rise in debt-to-GDP ratios varying from 45 percentage points in the U.S. to over 75 percentage points in Canada. Across mature markets, government debt has again been the main driver of the rise, increasing the most in Canada, Japan, the U.S., the UK and Spain.” – bto: All dies unterstreicht die Notwendigkeit, eine Lösung für die Schulden zu finden. Deutschland taucht auf dem Chart trotz “Wumms” nicht auf. Fragt sich, ob das ein Grund zur Freude ist.
Quelle: Zero Hedge, IFF
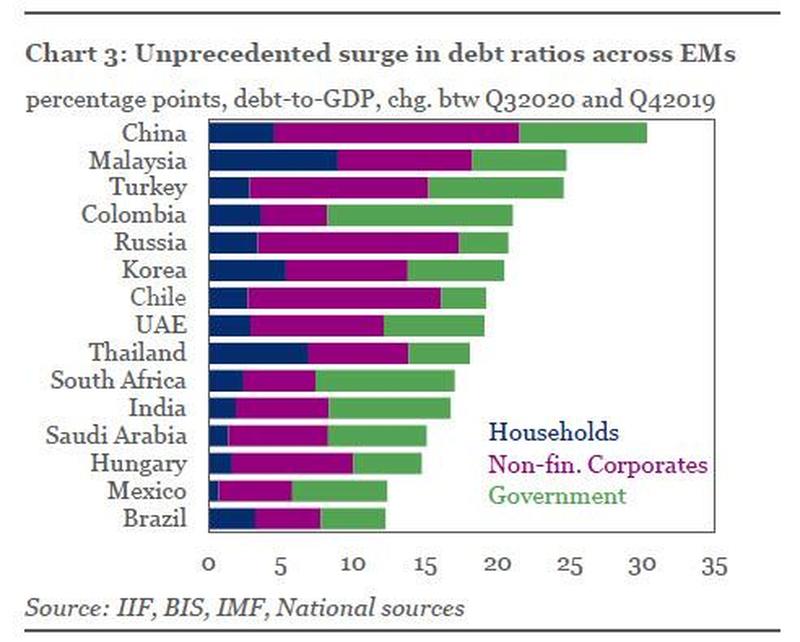
Und so sieht es in den Schwellenländern aus:
Quelle: Zero Hedge, IFF
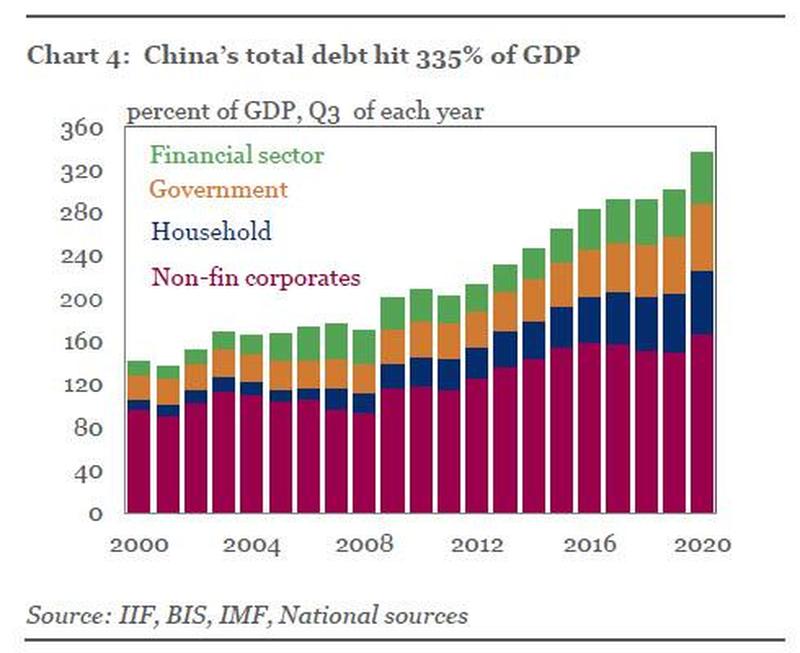
Offensichtlich hat die relativ gute Konjunkturentwicklung in China auch ihren Preis gehabt. Das sind Schuldenquoten, also eine Erhöhung der Schulden über das Wachstum der Wirtschaft hinaus (so diese gewachsen ist). “(…) the rise in non-financial corporate debt in China—from from 150% of GDP in Q3 2019 to over 165% in Q3 2020–has been striking. IIF estimates that China’s total debt-to-GDP topped 335% of GDP—vs 200% of GDP in 2011. This is a staggering amount, and is more than double official Chinese metrics.” – bto: Spielt das überhaupt eine Rolle? Vielleicht haben die Optimisten ja recht, dass es kein Gewicht hat.
Quelle: Zero Hedge, IFF
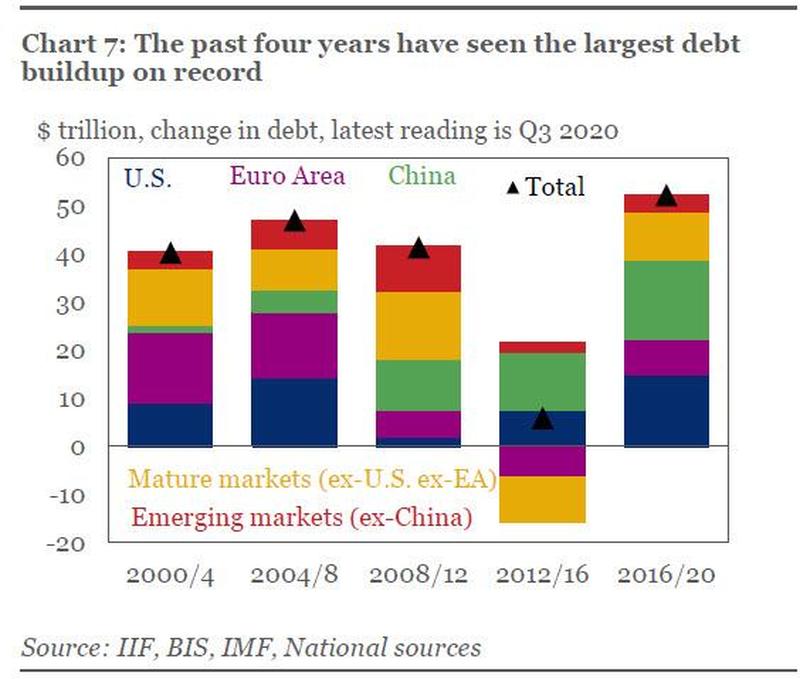
- Fazit IIF: “(…) the pace of global debt accumulation has been unprecedented since 2016, increasing by over $52 trillion. While some $15 trillion of this surge has been recorded in 2020 amid the COVID-19 pandemic, the debt build-up over the past four years has far outstripped the $6 trillion rise over the previous four years and over earlier comparable periods.” – bto: was zusammenfasst, dass wir uns auf einem unabhängig von Covid 19 beschleunigten Weg befinden.
Quelle: Zero Hedge, IFF
Die Abbildung zeigt sehr schön die Blase in der Eurozone: deutlicher Verschuldungsanstieg, dann die Phase des Austritts, in der die Schulden erst langsamer wuchsen und dann sogar sanken. Das erklärt, warum die Wirtschaft nicht richtig auf die Beine kam. Jetzt gibt es wieder mehr Schulden. China ist seit 2009 die (Schulden-) Lokomotive.
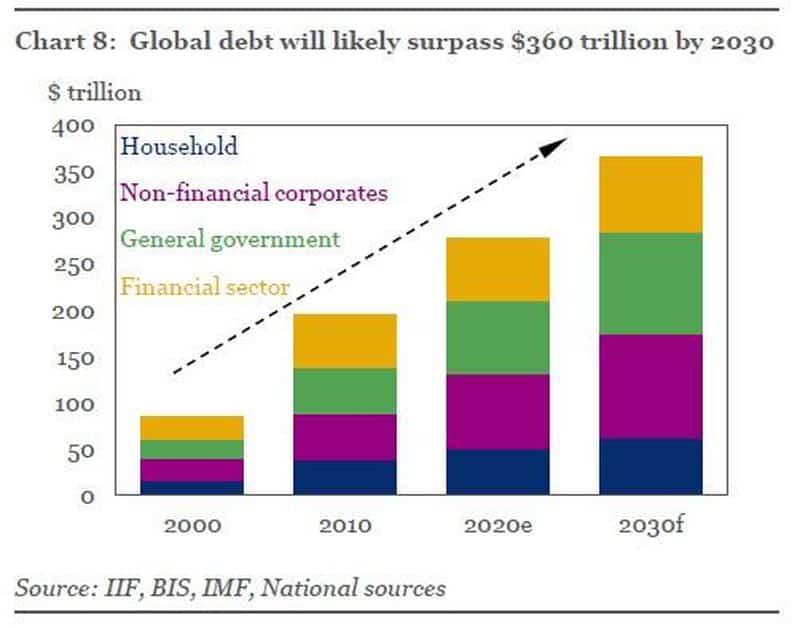
Und es geht weiter: “if the global debt pile continues to grow at the average pace of the last 15 years, our back-of-the-envelope estimates suggest that global debt could exceed $360 trillion by 2030—over $85 trillion higher than current levels”. – bto: Ich würde sagen mindestens, denn die wahren Programme zur Schuldensteigerung werden doch erst vorbereitet.
Quelle: Zero Hedge, IFF
Es ist Zeit für das “monetäre Endspiel”: → Das monetäre Endspiel wird vorbereitet