bto 2018: Die (kommende?) Blase bleibt ein Thema
Beiträge von Jeremy Grantham und seinen Kollegen von GMO werden häufig bei bto besprochen. Immer wieder faszinieren die gründlichen Analysen, die nicht immer negativ sind. So verweisen sie schon seit Jahren auf das erhebliche Potenzial in den Emerging Markets.
Immer wieder lesenswert:
→ Was steckt hinter den hohen Margen der US-Unternehmen?
Heute nun eine radikale und nicht von der Hand zu weisende These zur US-Börse (und damit wohl den Weltmärkten): Das Beste könnte noch kommen! Wobei man aus der Tatsache, dass der eher skeptische Grantham das schreibt auch schon schließen könnte, dass es eben diesmal nicht so kommt.
Egal, schauen wir uns die Argumentation genauer an:
- “I recognize on one hand that this is one of the highest-priced markets in US history. (…) I also recognize that we are currently showing signs of entering the blow-o or melt-up phase of this very long bull market. (…) We can be as certain as we ever get in stock market analysis that the current price is exceptionally high. (…) I find the less statistical data more compelling in this bubble context than the simple fact of overpricing.” – bto: Hohe Bewertungen alleine genügen nicht. Natürlich.
- “Price alone seems to me now to be by no means a sufficient sign of an impending bubble break. Among other factors, indicators of extremes of euphoria seem much more important than price. Ben Graham (…) said that as far as he could see no bubble had ever broken (by 1963) without being accompanied by signs of real excess such as those found in 1929. Two months ago, Robert Shiller also made the point (…) that not nearly enough signs of euphoria were yet present to make this look like a late-stage bubble.” – bto: Es könnte allerdings auch sein, dass wir auf den falschen Markt schauen. Es könnte doch viel mehr im Bereich der Unternehmensanleihen seien, als bei Aktien? Da haben wir durchaus einige Indikatoren für Euphorie (oder lasst uns Sorglosigkeit sagen).
- “(…) previous bubbles have been separated from ordinary bull markets by passing through 2 standard deviations on their price series, a level that statistically should occur every 44 years in a random series. (…) this time, this statistical measure has been misleading because as the US market hit a 2-sigma level, it had almost none of the other more important bubble indicators of investor euphoria and even craziness. (…) In complete contrast, late 1999 and early 2000 had very many signs of bubbly, completely irrational behavior, just as mid, or even early 1929 had.” – bto: also doch nur der Punkt der fehlenden Euphorie. Vielleicht kommt es ja diesmal genau deshalb anders?
- “(…) what is missing in the way of psychological and technical signs of a late-stage bubble and what is beginning to fall into place. (…) is acceleration of price. (…) The average time of the final bubble phase of the great equity bubbles shown in Exhibit 1 is just under 3.5 years, with the average upcycle of real acceleration just 21 months. And the two smaller equity bubbles had gains of 65% and 58%.” – bto: Was für eine wirklich beeindruckende und schöne Darstellung!
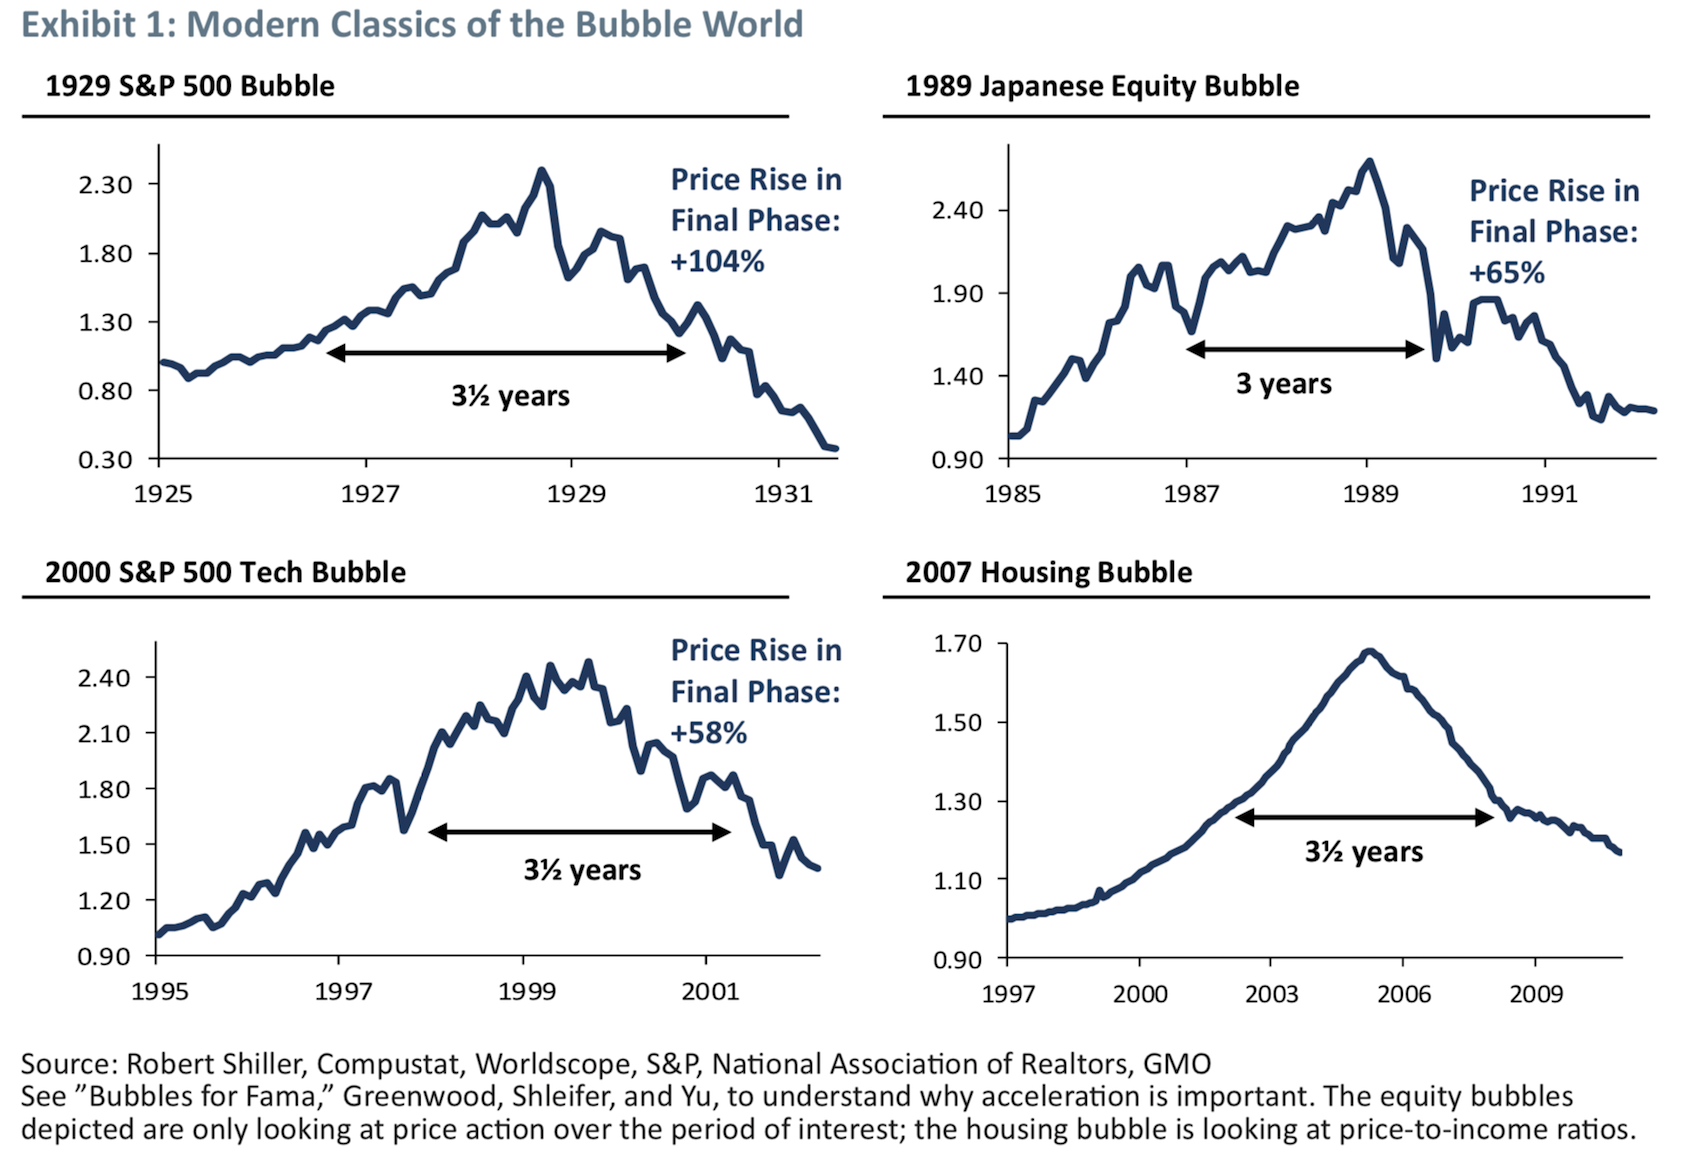
Quelle: GMO
- “(…) an academic paper titled ‚Bubbles for Fama‘ 2 concluded that in the US and almost all global markets, the strongest indicator – stronger than pure pricing or value – was indeed price acceleration. (Robin Greenwood, Andrei Shleifer, and Yang Yu, Harvard University, Revised, February 2017).” – bto: Das werde ich auch mal lesen, ist doch der Titel schon interessant, weil er sich gegen Nobelpreisträger Fama wendet, der immer – zuletzt im Interview mit der ZEIT – kategorisch ausschließt, dass es Blasen gibt. Und wenn, wüsste man es immer erst im Nachhinein.
- “Exhibit 4 represents our quick effort at showing what level of acceleration it might take to make 2018 (and possibly 2019) look like a classic bubble. A range of 9 to 18 months from today and a price rise to around 3,400 to 3,700 on the S&P 500 would show the same 60% gain over 21 months as the least of the other classic bubble events.” – bto: Dann hätten wir den schönsten Teil der Aufwärtsbewegung ja noch vor uns :-)
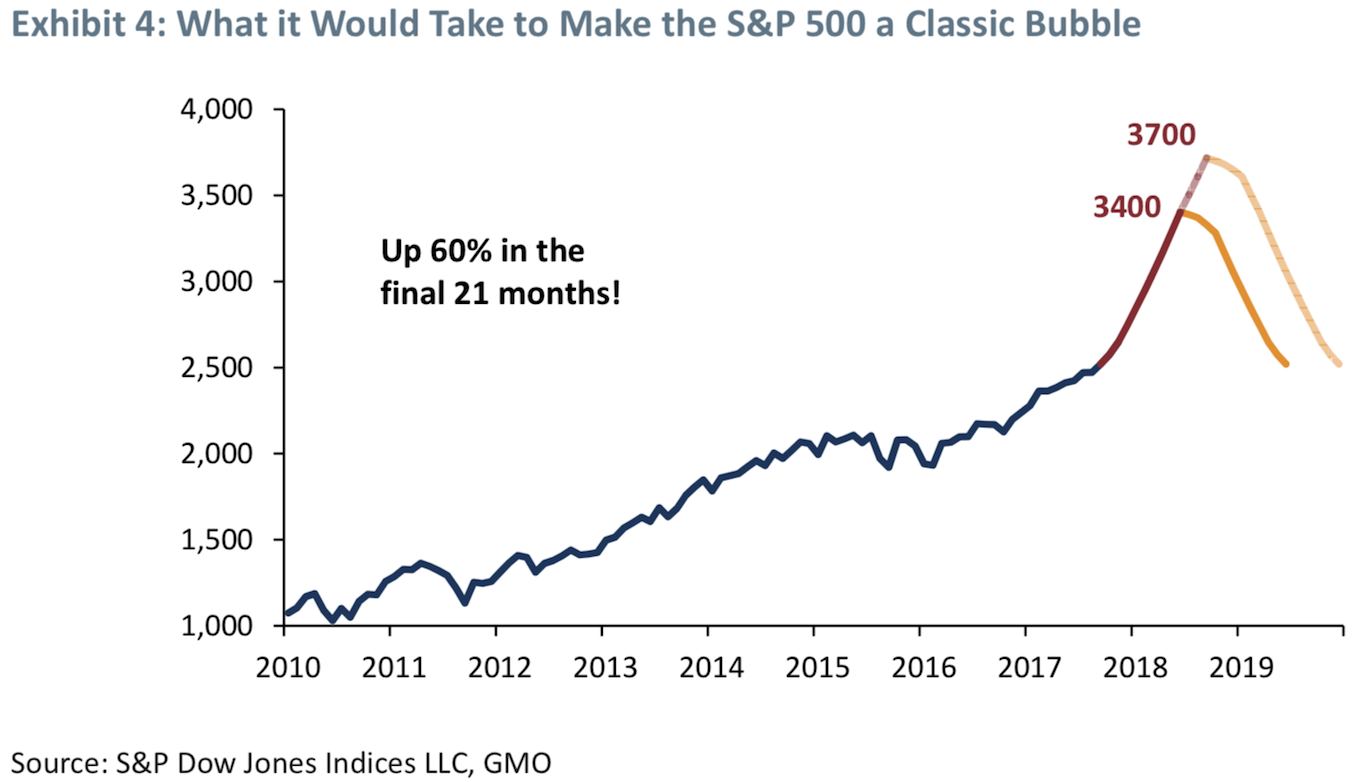
Quelle: GMO
- “I have previously defined a great bubble as being ‚Excellent Fundamentals Euphorically Extrapolated.‘ (…) in general, the fundamentals of recent years were disappointing and that investors, far from being euphoric, had instead been ‚climbing the wall of worry‘ as they used to say. But fundamentals are improving. The global economy is in sync for the first time in a dozen years and global profit margins are at a high; in the US, a corporate tax cut is on the way, which in today’s sticky, more monopolistic world, is unlikely to be quickly competed away as theory suggests, but very likely to further fatten the corporate share of the GDP pie and perhaps provide the oomph to keep stock prices rising.” – bto: was eine stringente Logik ist. Oder aber die Blase entsteht ganz wo anders, nicht bei den Aktien
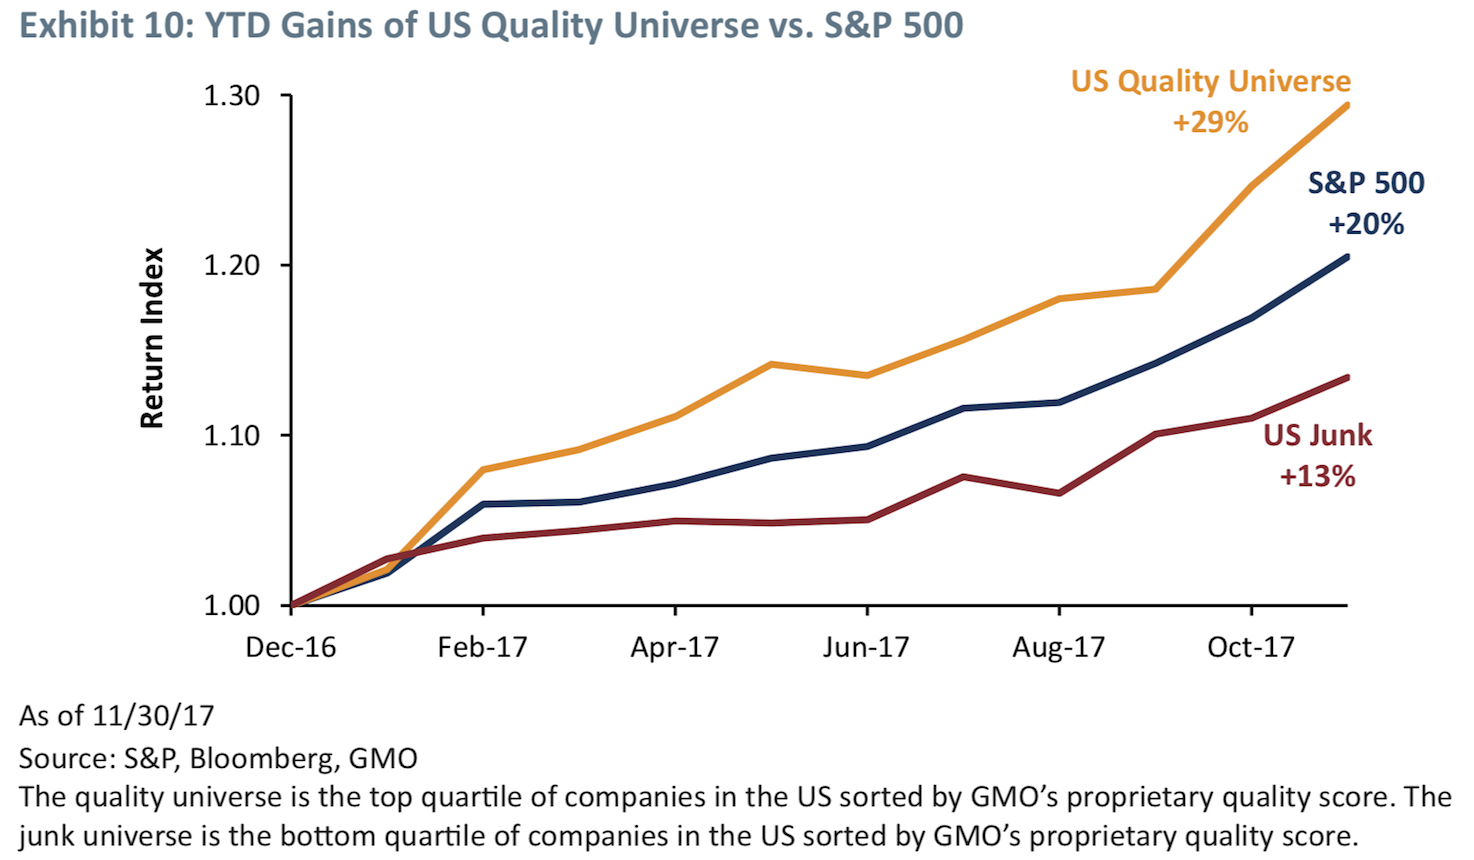
- “Concentration is the essence of an escalating euphoria. By late-stage cycles, many buyers are fixating on ‚winners‘ with the purchase motive being further stock gains, rather than any logic of long-term value. Thus, as the market soars, attention is increasingly focused on those with the largest earnings and stock price gains (…).” – bto: anybody FANGs?
- The second principle is the outperformance of quality and low beta stocks in a rapidly-rising market. (…) I attribute the logic for this – and this effect is something I noticed almost 40 years ago when studying the Crash of 1929 – to Chuck Prince; a series of Chuck Princes over the years might have said, “The market keeps going up faster and faster and there is no way commercially that I can play against it. So I have to keep dancing.” – bto: Also, die Profis sehen, dass der Markt zu teuer ist und deshalb kaufen sie das, was nicht so stark fallen dürfte. In sich logisch, dennoch problematisch. Denn: “It makes at least some sense and in 1929 caused you to lose a mere 80% rather than 95% (…).”
- “A reasonable indicator of increasing concentration is the advance-decline line (…) But my favorite all-time data is shown in Exhibit 6. is (…) the S&P’s “Low Price Index,” comprising very fallen industrial angels. (…) in 1929, it produces what I call the great primal scream of all-time from the market: By the time the S&P 500 peaks in October, up 35% for the year, accompanied by all the touchy-feely signs of crazy speculation, the Low Price Index is down 37%, having fallen steadily all year!” – bto: Das ist in der Tat eine wunderschöne Darstellung!
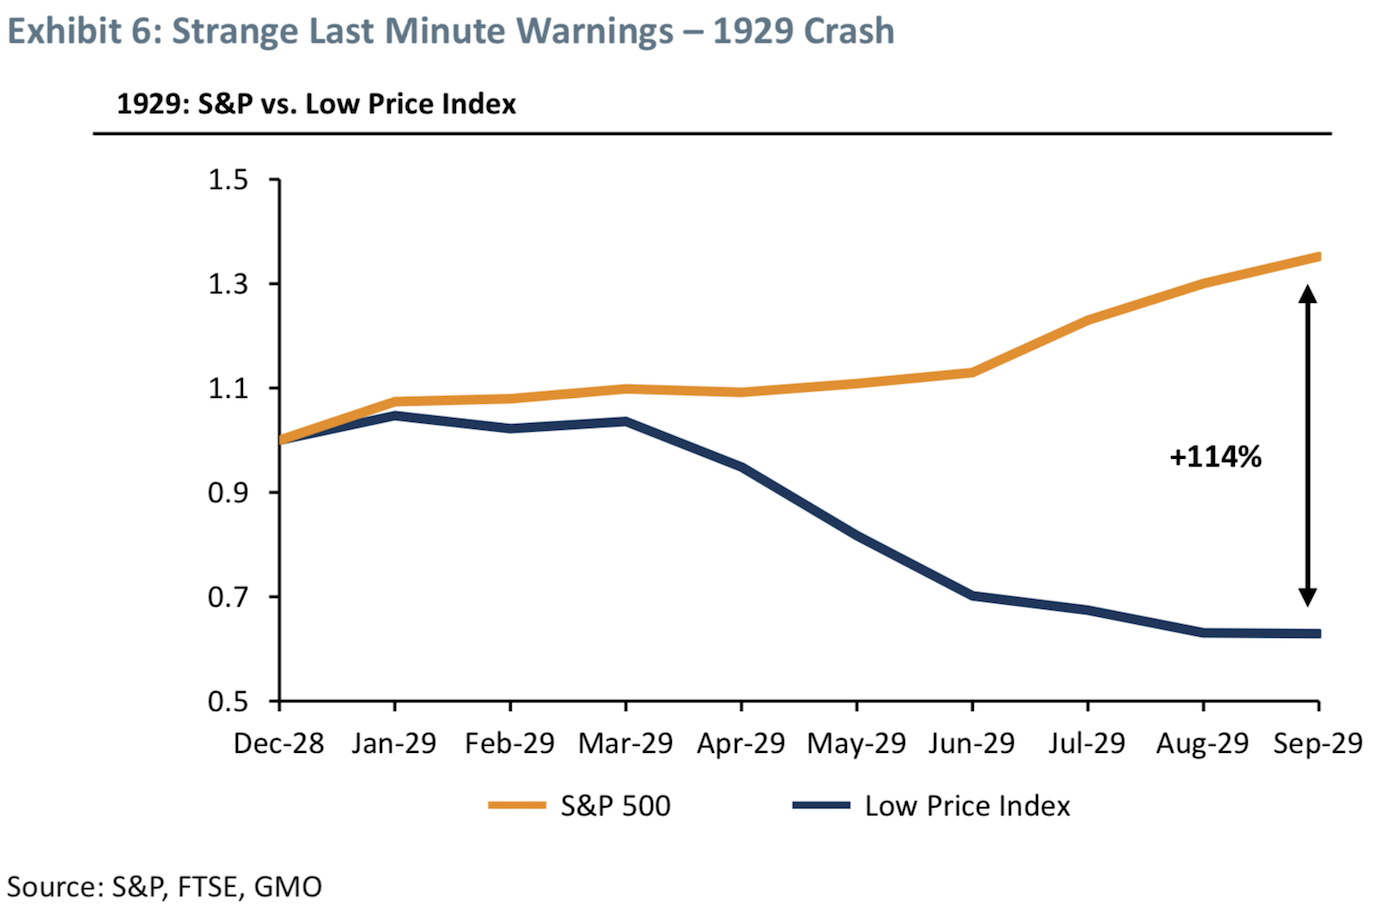
Quelle: GMO
- “And most compelling for me is that (…) that high-beta stocks were soundly beaten as the S&P 500 rose significantly. And the 1972 high ushered in by far the biggest stock market decline since the Great Depression. The 1973-74 decline in the S&P was 63% in real terms, still the second worst decline to date in the post 1925 era. You have to admit this odd signal did a great job in these first two bubbles of the twentieth century.”
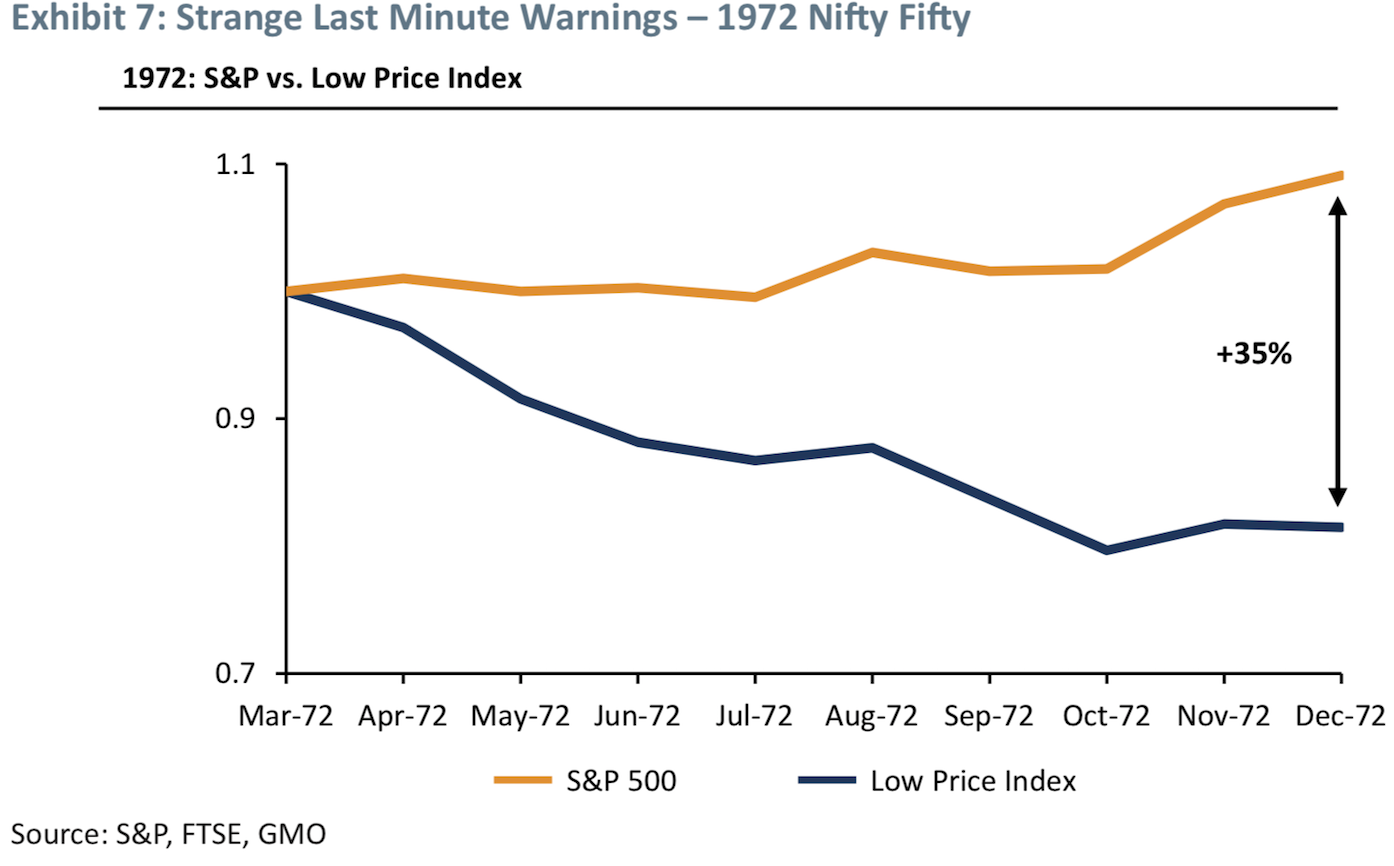
Quelle: GMO
Doch nun zu der eigentlichen Frage: Wo stehen wir heute?
- “The advance-decline line is clearly not delivering a threatening message yet. It has risen, apparently inexorably, along with the S&P 500, perhaps helped along by the rising percentage of index purchases. So, for the time being, no bubble-bursting early warning there. The high-beta- loses paradox, on the other hand, appears to be giving a very early warning as quality stocks extend an unusual upside lead.” – bto: Will heißen, dass es eine Präferenz für relative Sicherheit gibt wie 1929.
Quelle: GMO
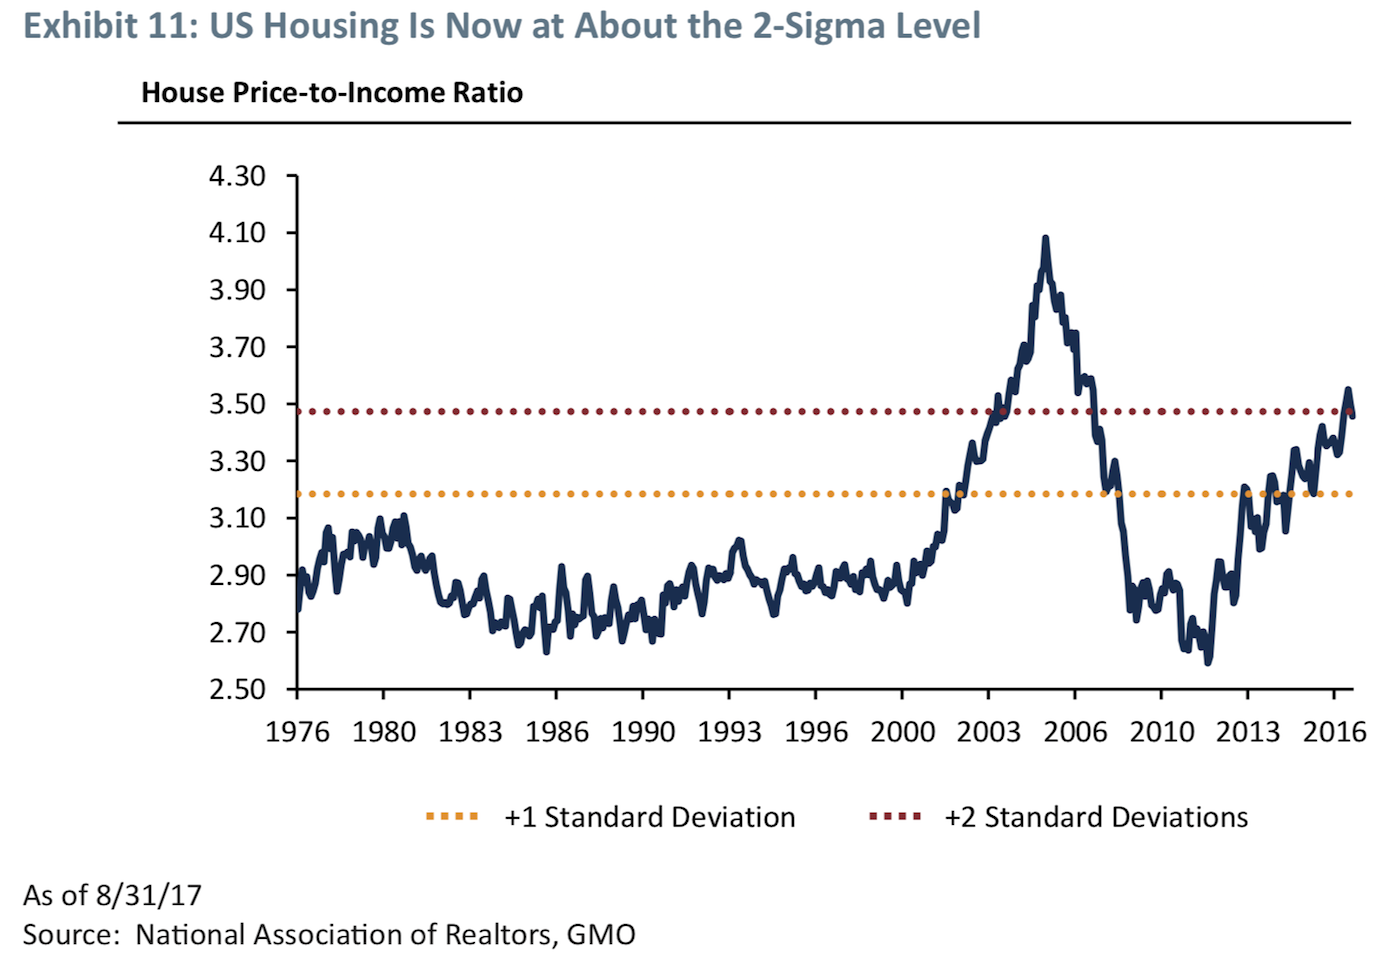
- Grantham schaut dann auch auf andere Märkte (allerdings nicht auf Unternehmensanleihen von schlechter Qualität, wo ich eher die Blasenrisiken sehe, sondern auf die US-Immobilien: “The average US house price, as a multiple of family income, is way higher than at any time before the great 3-sigma housing bubble of 2006. Those extraordinary and nationwide prices then perhaps serve to camouflage the current 2-sigma rise, as the outrageous prices of 2006 make today’s high prices seem less unreasonable.” – bto: Das gilt übrigens auch für die Börse. Wir vergleichen immer mit den Preisen während des längsten Börsenbooms seit Mitte der 1980er-Jahre und ich denke, das ist der falsche Maßstab.
Quelle: GMO
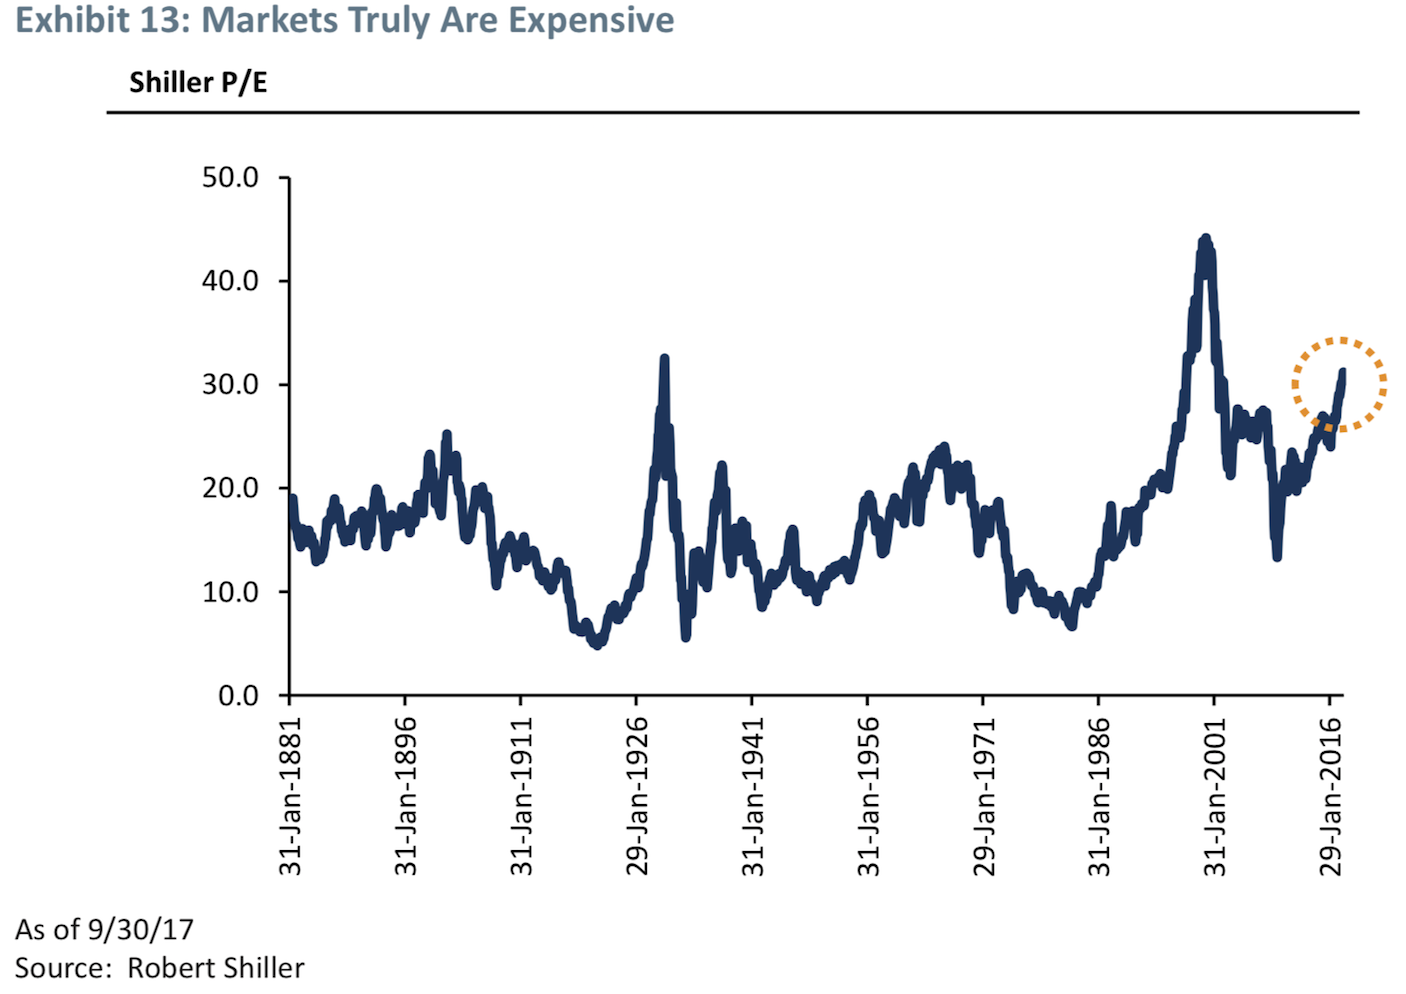
- “Extreme overvaluation plays a huge role in bubbles breaking: It is anecessary precondition. The more overvalued, the merrier. But, for judging the extent that bubbles will overrun fair value and for timing the break, value, sadly, is largely irrelevant. Thus, it is a necessary but absolutely not sufficient condition.” – bto: Und wie weit die Bewertung schon gelaufen ist, haben wir bei bto immer wieder diskutiert. Hier nochmals das entscheidende Chart:
Quelle: GMO
- Grantham sieht wie viele andere auch, u. a. auch bto, eine erhebliche Mitschuld der Notenbanken, hier der Fed: “Taking a different tack, we should look at the policy of what I call the Greenspan-Bernanke-Yellen Fed. This policy of pushing down generally on rates – lower highs and lower lows – over 25 years, accompanied by a lot of moral hazard, has very probably helped push asset prices higher. (…) It seems likely that such a policy as the Greenspan Put might culminate periodically in investment bubbles (…) And the likelihood of bubbles forming no doubt increased because all three Fed bosses outspokenly denied that such bubbles were occurring even as they passed through 2-sigma levels. (…) Think how encouraging this was to the bulls as the market in 1998 went past the 21x peak of 1929 and climbed remorselessly (and at an accelerating rate!) to 35x. Even more statistically remarkable was Bernanke’s dismissal of a clear 3-sigma US housing market – a one in a thousand event normally – as “merely a reflection of a strong US economy,” and that “US house prices had never declined!” (…) But, of course, the US housing market had never been tested by a 3-sigma bubble before! And the rest is history.” – bto: Und Grantham zweifelt – wie auch ich – nicht im Geringsten daran, dass die Fed bei der nächsten Krise mit noch mehr Geld reagieren wird!
Was Grantham dann zu seiner Schlussfolgerung führt:
“Summary of my guesses (absolutely my personal views)
- A melt-up or end-phase of a bubble within the next 6 months to 2 years is likely, i.e., over 50%.
- If there is a melt-up, then the odds of a subsequent bubble break or melt-down are very, very high, i.e., over 90%.
- If there is a market decline following a melt-up, it is quite likely to be a decline of some 50%.
- If such a decline takes place, I believe the market is very likely (over 2:1) to bounce back up way over the pre 1998 level of 15x, but likely a bit below the average trend of the last 20 years, as the trend slowly works its way back toward the old normal on my ‚Not with a Bang but a Whimper‘ flight path.”
– bto: eine stringente Logik. Was allerdings dagegen spricht, ist, dass ausgerechnet einer der ganz großen “Bären” nun eine weitere Fortsetzung des Bullenmarktes sieht. Spricht das nicht alleine für ein früheres Ende?
→ GMO: “Bracing Yourself for a Possible Near-Term Melt-Up”, 3. Januar 2018