Börse: deshalb ist es mehr als eine Korrektur
John Hussman war schon mehrfach auf diesen Seiten vertreten, immer mit derselben – langweiligen? – Nachricht: Die US-Börse ist abenteuerlich teuer, man verdient bestenfalls nichts, realistischerweise gibt es einen Crash. Sein letzter Kommentar erschien vor dem letzten Einbruch, ist aber interessant mit Blick auf die weitere Entwicklung. Wer den Beitrag liest, kann nur zu dem Schluss kommen, es war der Anfang, nicht das Ende des Kursrückgangs:
- Direkt vor dem Einbruch “the U.S. equity market climbed to the steepest valuation level in history, based on the valuation measures most highly correlated with actual subsequent S&P 500 10-12 year total returns, across a century of market cycles. These measures include the S&P 500 price/revenue ratio, the Margin-Adjusted CAPE (our more reliable variant of Robert Shiller’s cyclically-adjusted P/E), and MarketCap/GVA – the ratio of nonfinancial market capitalization to corporate gross value-added, including estimated foreign revenues – which is easily the most reliable valuation measure we’ve ever created or tested, among scores of alternatives.” – bto: wobei wir wissen, dass die Bewertung alleine nicht beim Timing eines Einbruches an den Märkten hilft.
- The first chart below shows the ratio of MarketCap/GVA, which now stands beyond even the 2000 market extreme:
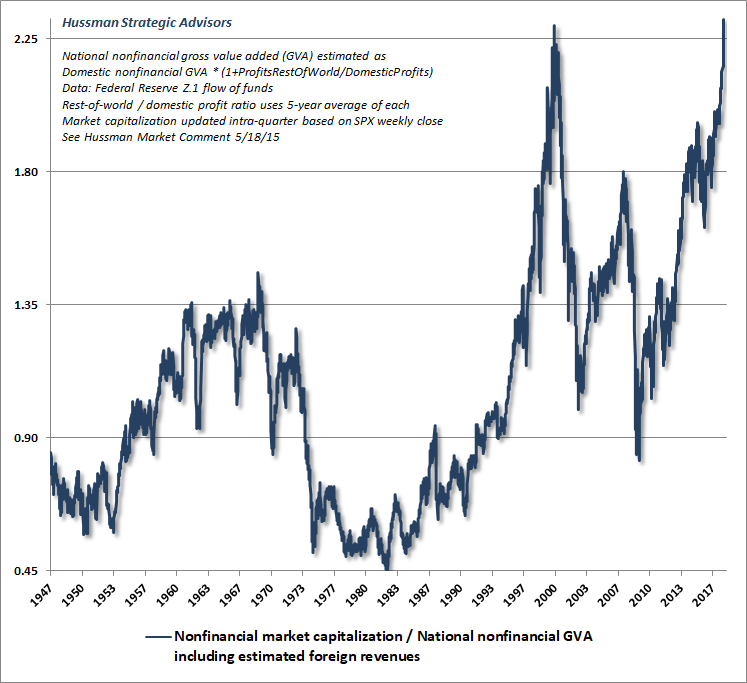
Quelle: Hussman
- “The next chart shows our Margin-Adjusted CAPE, in data since the 1920’s, which is also easily at the most extreme level in history. Notably, the relationship between the Margin-Adjusted CAPE and actual subsequent market returns is more reliable than for the raw Shiller CAPE.” – bto: ebenfalls ein sehr eindeutiges Bild.
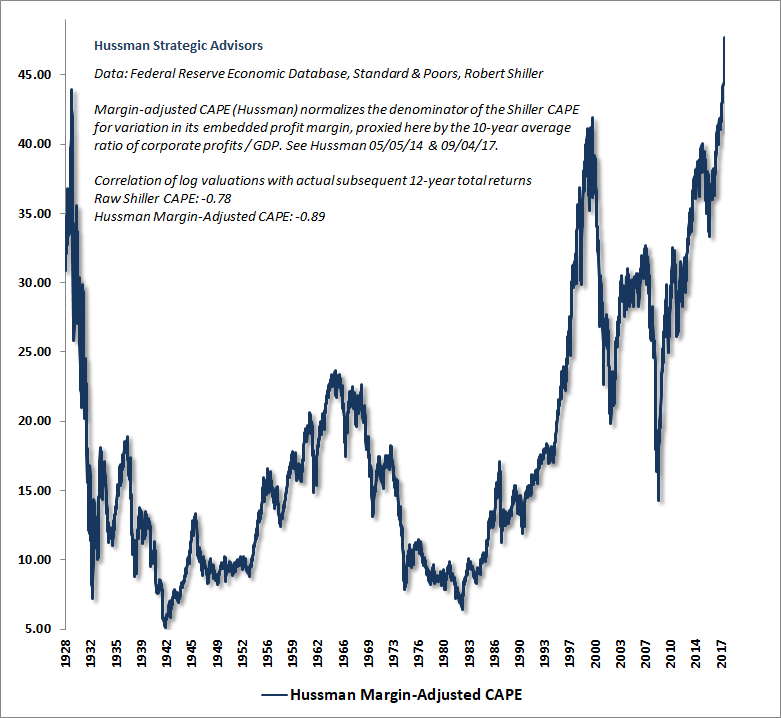
Quelle: Hussman
- “The essential thing to understand about valuations is that while they are highly reliable measures of prospective long-term market returns (particularly over 10-12 year horizons), and of potential downside risk over the completion of any market cycle, valuations are also nearly useless over shorter segments of the market cycle. The mapping between valuations and subsequent returns is typically most reliable over a 10-12 year horizon.” – bto: was für mich auch weitaus bedeutender ist als das genaue Timing. Natürlich wäre Letzteres toll, ist aber schwer zu erzielen.
- “Recognizing that valuations matter profoundly over the long run, yet are nearly useless over the short run, is central to navigating complete market cycles. The main driver of market returns over shorter segments of the market cycle is the purely psychological inclination of investors toward speculation or risk-aversion. Aside from an occasional bit of lip-service, followed by reassuring justifications, investors entirely dismiss the level of valuations when they have the speculative bit in their teeth.” – bto: wie wir in den letzten Jahrzehnten mehrfach erleben konnten. Zuletzt wohl in den letzten drei Jahren.
- “Fortunately, when investors are inclined toward speculation, they tend to be indiscriminate about it, so in our own methods, we extract a signal about speculation or risk-aversion from the uniformity or divergence of market action across thousands of individual securities, sectors, industries, and security-types, including debt securities of varying creditworthiness. We don’t publish those methods, but suffice it to say that when the market demonstrates divergences and breakdowns in the behavior of various sectors, that loss of ‚uniformity‘ is often a signal that investor preferences have subtly shifted toward risk-aversion.” – bto: So hat übrigens auch Grantham von GMO in seinem “Melt-up”-Artikel argumentiert. Sobald stabilere Aktien outperformen, haben wir einen klaren Indikator dafür, dass es am Markt in die Endphase geht. Ähnlich dürfte der Indikator von Hussman gebaut sein.
- “I expect that the S&P 500 will lose approximately two-thirds of its value over the completion of this market cycle. (…) the first leg down will be extremely steep, and that a subsequent bounce will encourage investors to believe the worst is over. Study market history. The trouble rarely ends until valuations have approached or breached their long-term norms.” – bto: Und das ist es, was ich auch denke. Dennoch würde ich nicht alles auf diese Karte setzen.
- “(…) interest rates are depressed, but so too are the structural drivers of economic growth and corporate income, and much of that is baked in the cake of demographic factors like population growth. Low interest rates emphatically do not “justify” valuations anywhere near three times their historical norms.” – bto: Das hatten wir regelmäßig hier, zuletzt in der vergangenen Woche.
- “We hear numerous observers saying that stocks are ‚cheap relative to interest rates.‘ Specifically, analysts argue that the ‚equity risk premium‘ – the expected return of stocks over and above that of Treasury bonds – is actually quite satisfactory at present. (…) The blue line is our estimate of the expected 12-year total return of the S&P 500 over and above Treasury bond returns. The red line shows the actual subsequent ‚equity risk premium‘ over that horizon. The correlation between the two is over 90%. (…) we presently expect the S&P 500 to lag the return on Treasury bonds over the coming 12 years by a substantial amount. That interpretation is correct. We fully expect stocks to lose value over this horizon on a total return basis, given present valuations.” – bto: Das wirft natürlich die Frage auf, was man mit seinem Geld machen soll?
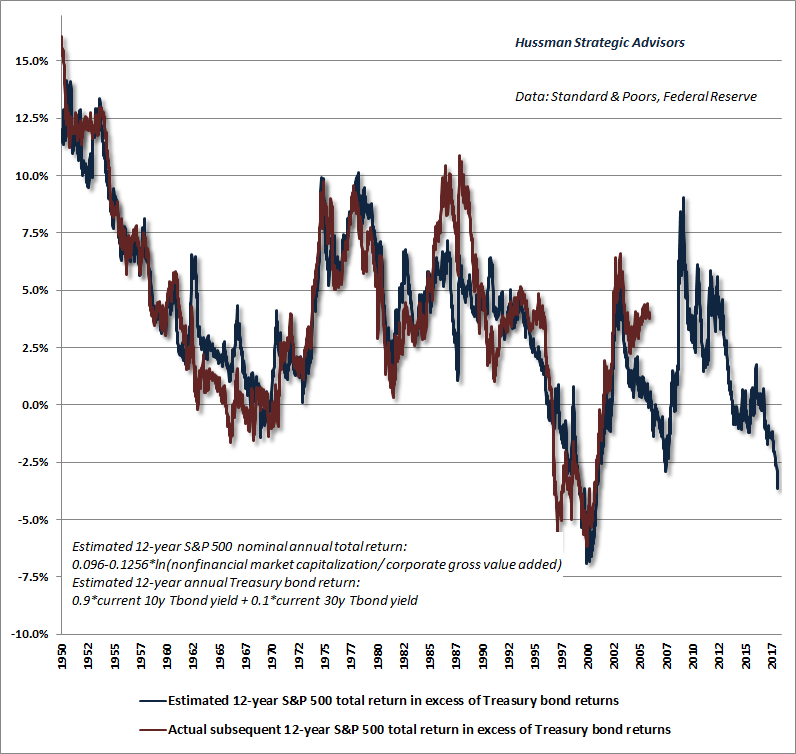
Quelle: Hussman
- “Presently, depressed interest rates simply add insult to injury, because both stocks and bonds are now at valuations that imply dismal future returns for passive investors. That situation will undoubtedly change over time, but here and now, we estimate an expected total return averaging just 0.5% annually for a conventional mix of passive investments (60% S&P 500, 30% Treasury bonds, 10% Treasury bills) over the coming 12-years.” – bto: was logisch ist, wenn wir eine Rückkehr zur Normalität erwarten.
- “Yes, speculation can and occasionally does take the market to a multiple of its appropriate value. The only alternative to this view is to imagine that the collapses that followed valuation extremes like 1929, 1973, 2000, and 2007 somehow emerged entirely out of the blue, ignoring the fact that valuations accurately projected likely full-cycle losses, and remained tightly correlated with total returns over the subsequent 10-12 year horizons.” – bto: So ist es leider.
- “I’ve periodically discussed the concept of ‚log periodic power-law‘ price behavior, which has accompanied speculative episodes in numerous markets and often precedes inflection points or collapses. This structure is based on a purely mathematical fit to price behavior, and does not reflect any valuation considerations. (…) The chart below shows our current best-fit parameterization of Sornette’s log-periodic structure, applied to the S&P 500 Index. Notably, unless we allow for the slope of the current market advance to become quite literally infinite, it’s impossible to closely fit the current price advance without setting the ‚finite-time singularity‘ – the point at which instability typically emerges – within a few days of the present date. Notably, the singularity is not the date of a crash. Rather, it’s the point where the pitch of the advance reaches an extreme, which may simply be an inflection point (as has been the case for other structures in recent years) or a pre-crash peak.” – bto: Und dann kam der Einbruch. Interessant.

Quelle: Hussman
- “(…) my opinion is that this singularity will prove to be more than an inflection point. (…) the steepening pitch of this ascent – coupled with record valuation extremes, record overbought extremes, and the most lopsided bullish sentiment in over three decades – now produces the most extreme ‚overvalued, overbought, overbullish‘ moment in history. (…) I expect the S&P 500 to lose approximately two-thirds of its value over the completion of this cycle. My impression is that future generations will look back on this moment and say ‚(…) and this is where they completely lost their minds.‘” – bto: So ist es. Mit verheerenden Folgen für das soziale Gefüge.