1929, 1989 und 2008: Nur die USA konnten sich absetzen
Diese kleine Analyse fand sich vor einiger Zeit in dem täglichen – kostenfreien und sehr empfehlenswerten – Newsletter von John Authers von Bloomberg. Der Vergleich der Börseneinbrüche von 1929, in Japan 1989 und 2008 in den USA und im Rest der Welt. Interessant ist, wie sehr der Rest der Welt den früheren Baissen ähnelt, während die USA sich immer weiter absetzen konnten. Bis jetzt:
- “After the credit bubble burst in late 2007, my prediction (along with that of many others) was that we would watch stocks settle into a classic drawn-out bear market.(…) This is what happened to the Dow Industrials after the great crash of 1929 (in red below), the Nasdaq Composite after the dot-come bubble burst early in 2000 (shown in purple), and Japan’s Nikkei 225 after its great bull market peaked on New Year’s Eve 1989.” – bto: Das habe ich auch gedacht und deshalb an der großen Erholung nur partiell teilgenommen.
- “In the U.S., stocks have confounded such predictions. But if we look at the MSCI ACWI index excluding the U.S., an index that effectively covers all the world’s non-American stock markets, we can see that the pattern is indeed similar to the previous great post-bubble bear markets. It is shown in white:” – bto: was dadurch verstärkt wird, dass zum Beispiel in der Eurozone die Kreditblase größer war als in den USA und wir auch weniger gut auf die Krise reagiert haben.
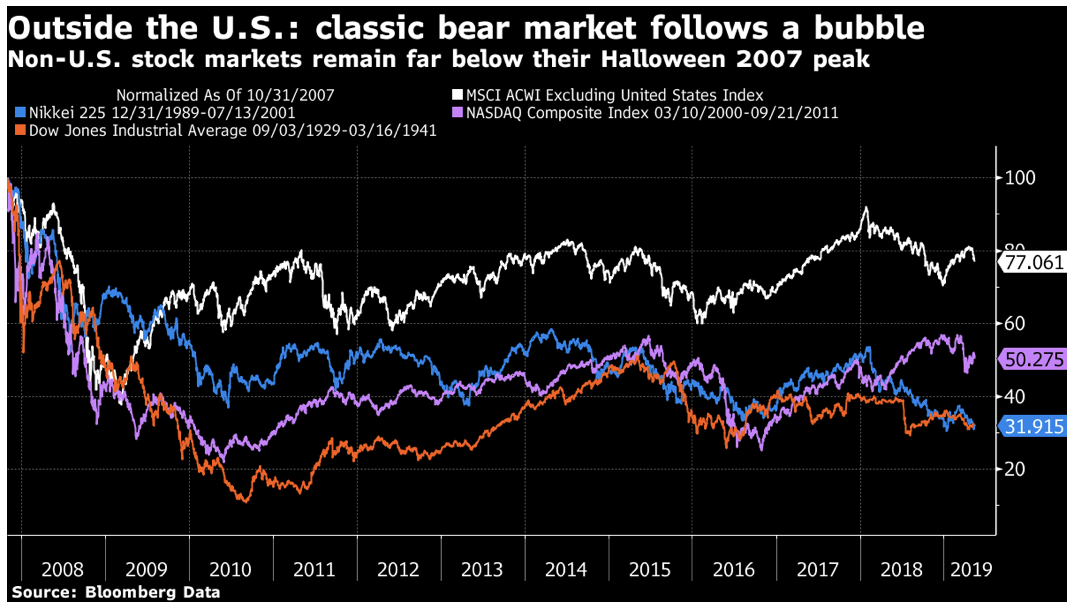
Quelle: Bloomberg
Das zeigt auch dieses Chart, das S&P 500 mit dem Rest der Welt vergleicht:
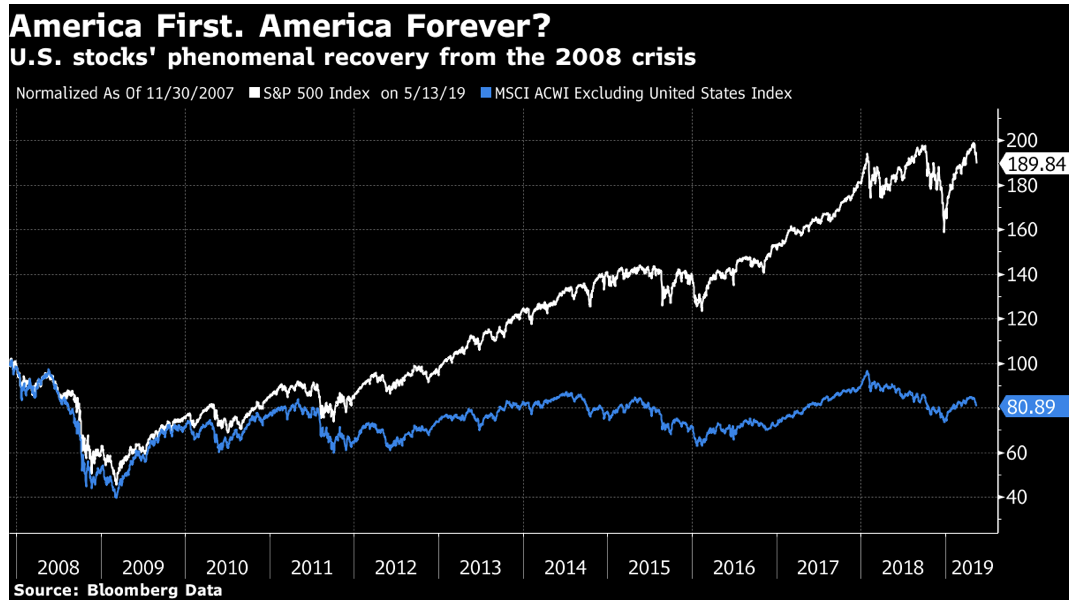
- “It looks as though the U.S. stock market has dodged a post-bubble reckoning. Can it really continue to do so?” – bto: Das ist in der Tat eine sehr interessante Frage. War es wirklich eine Lösung der Probleme oder haben die USA nur richtig Anlauf genommen für die nächste Phase der Krise?
Blackrock zeigt uns dann noch, was hinter der Entwicklung der Aktien steht:
- “Since 2010, the S&P 500 Index has outperformed (on a price basis) the MSCI ACWI ex-U.S. Index by an average of 70 basis points (bps) a month, a statistically significant difference.” – bto: Das kann man wohl sagen, denn die USA sind auf dem Weg Richtung Japan ja auch etwas zurück.
- “All of this raises the question: Why have U.S. stocks been perennial out-performers since the financial crisis? There are many potential explanations, but one simple one is profitability. (…) Since the beginning of 2010 the average ROE spread between the two indexes has widened to 3.7%. Just as important, (…) not only have U.S. companies been significantly more profitable than their non-U.S. counterparts, but excess U.S. profitability has been consistently more reliable in the post-crisis environment.” – bto: was auch damit zu tun hat, dass die USA wirklich einen, wenn auch schwachen, so doch stabilen Aufschwung hatten.
- “U.S. growth, while below the pre-crisis norm, has been consistently faster than Europe and Japan, particularly when you compare nominal growth, i.e. the rate of growth before adjusting for inflation. Faster growth supports higher operating leverage.” – bto: Ein deflationäres Umfeld ist so gesehen Gift für Aktien.
- “The U.S. is also increasingly home to the world’s marquee companies in technology and communications, companies that tend to be consistently more profitable than the broader market.(…) The top three companies in the S&P 500 are Microsoft, Apple and Amazon. Their average ROE is 39%. By contrast, the top three companies in Europe–Total, SAP and LVMH–have an average ROE of 14%. Perhaps it’s not such a mystery why U.S. companies, despite materially higher valuations, continue to outperform.”
Und das haben sie auch in den letzten zwölf Monaten, wie diese Analyse der Kurstreiber zeigt:
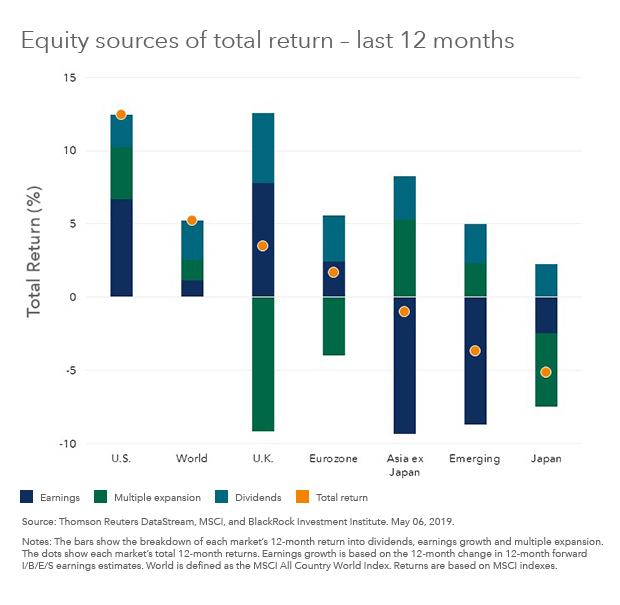 Quelle: Blackrock
Übrigens ein Bild, das Werbung für UK und Japan macht.
→ bloomberg.com: “China May Have Miscalculated Trump’s Weak Spot”, vom 14. Mai 2019
→ blackrockblog.com: “The roots of U.S. stocks out-performance”, 11. Mai 2019