Die Folgen hoher Bewertungen
Immer wieder habe ich die Folgen der hohen Bewertung für künftige Erträge an dieser Stelle diskutiert. So hier: → Eiszeit an den Kapitalmärkten. Auch an anderer Stelle habe ich die Quellen, die John Mauldin hier verwendet, ebenfalls zitiert.
Es ist eine sehr schöne Zusammenfassung der Risiken, die wir zwar schon kennen, dennoch schön:
- Median PE-Ratio
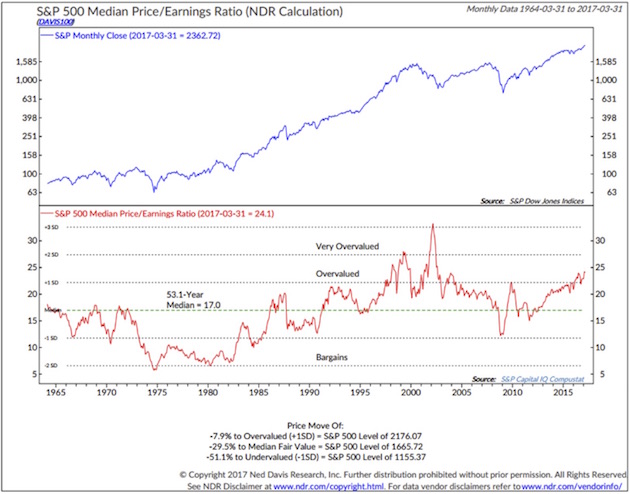
Laut Ned Davis, von dem das Chart stammt, ist die US-Börse 7,9 Prozent über dem Niveau, was als überbewertet angesehen wird.
2. Zu erwartende Renditen bei diesem Niveau
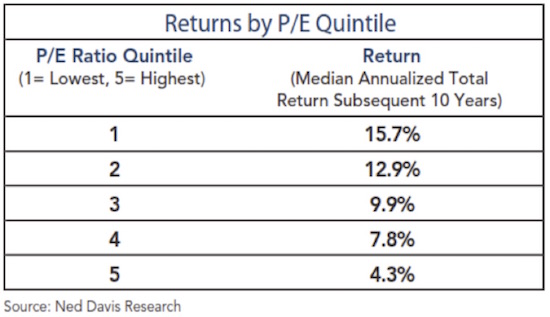
- “With a current median P/E for the S&P of 24, we find ourselves firmly in quintile 5. That tells us to expect low returns over the coming 10 years.”
3. Shiller PE (CAPE)
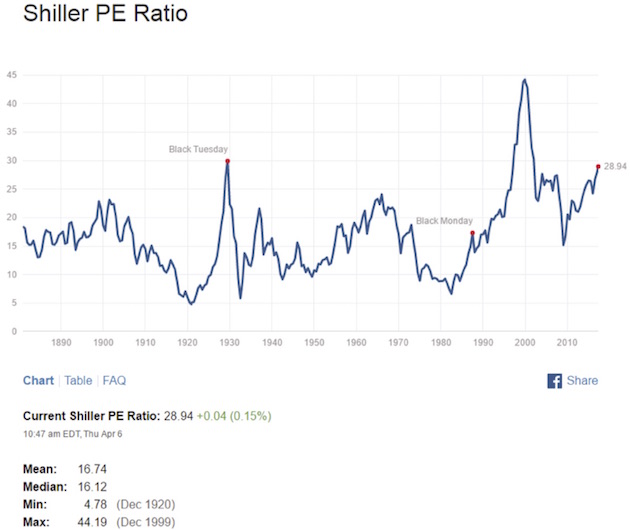
Diese Darstellung haben wir schon oft gezeigt – die immer gleiche Nachricht: Die Bewertung war nur zweimal höher: 1929 und 1999/2000.
4. Erwartete Rendite nach Anlageklasse (GMO’s 7-Year Asset Class Real Return Forecast)
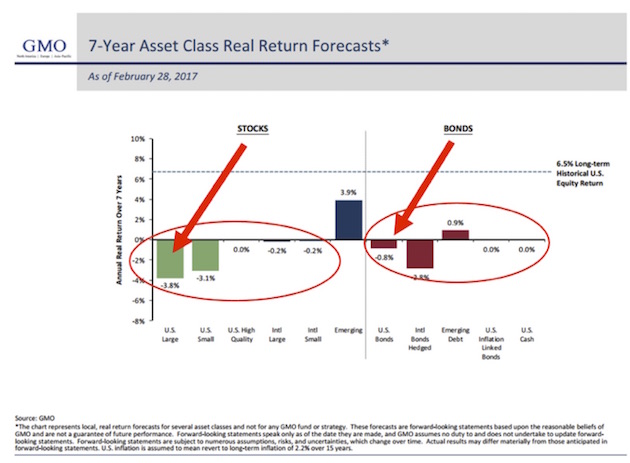
- “Each month for many years, GMO has published its forward return forecasts. There has been a high correlation over time between what GMO predicted and what turned out to be. An approximate 0.97 correlation, actually. That’s as close to the middle of the fairway as any forecaster has hit the ball, as far as I know, which is why you really need to take this forecast seriously.”
- “As of February 2017, GMO is forecasting a -3.8% annual return for US large-cap equities and a -0.8% for US bonds over the coming seven years.”
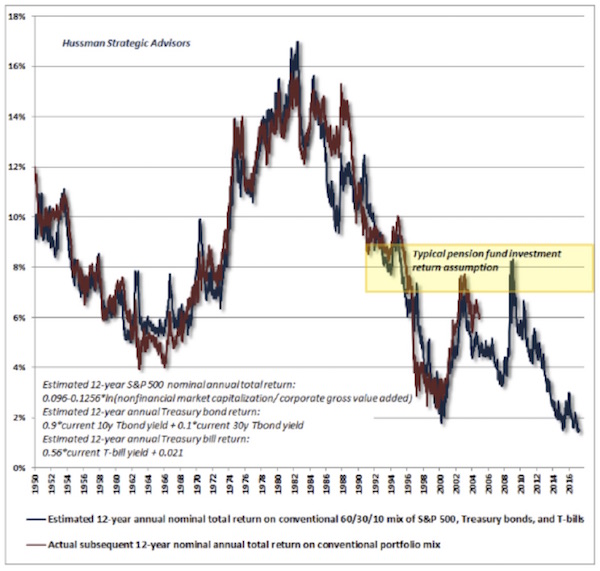
5. Hussman’s 12-year Return Forecast
“John Hussman shared this next chart, and it shows that his 12-year forecast is for 0% to 2% returns before inflation. This is a portfolio based on 60% equities, 30% Treasury bonds, and 10% Treasury bills. Basically, a typical 60/40 portfolio.”
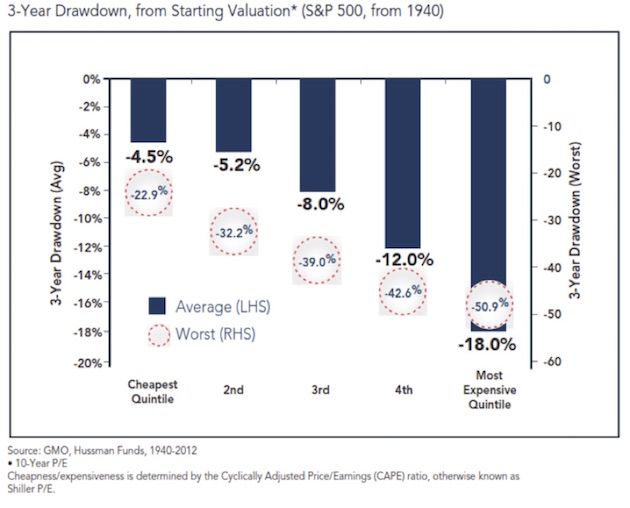
6. Wie groß wäre ein Einbruch?
- “When valuations are highest, not only are returns lowest but risk is highest. This chart shows that from where we are today we should expect an 18% drawdown in an average case and a worst-case -51% if there is a recession.”
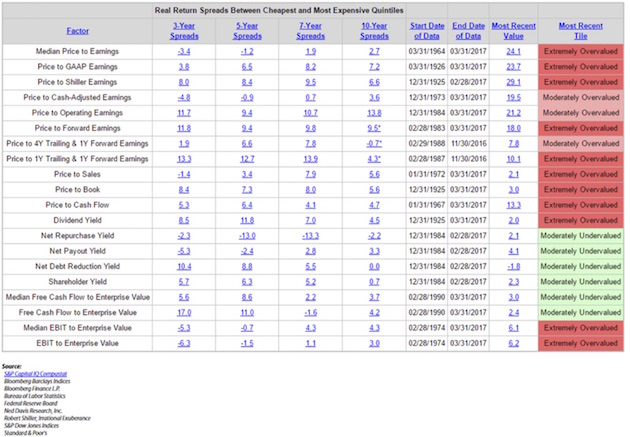
7. 20 verschiedene Bewertungsindikatoren
- “The chart below looks at 20 different ways you can value the stock market. (…) look to the far right – most valuation metrics are ‚Extremely Overvalued‘.”
Fazit: wenig Luft nach oben, deutliches Absturzrisiko.
→ Mauldin Economics: “Stock Market Valuations and Hamburgers”, 9. April 2017